
Technology lessons for educational technology integration in the classroom. Content for teachers and students.
Google Forms for vocabulary assignments
Vocabulary is such an important part of the development of language. It is important for the development of comprehension in reading. It facilitates language development. Increases communication skills. Facilitates the communication of ideas. Increases writing skills. This lesson demonstrates how to create assignments and assessments for vocabulary.

Introduction
Vocabulary is such an important part of the development of language. It is important for the development of comprehension in reading. It facilitates language development. Increases communication skills. Facilitates the communication of ideas. Increases writing skills. I have a couple of links below with information on the importance of vocabulary development.
https://www.scholastic.com/teachers/articles/teaching-content/understanding-vocabulary/
https://infercabulary.com/top-5-reasons-why-vocabulary-matters/
Spelling and using vocabulary in context is important. This lesson focuses on the use of Google Forms to create spelling assignments or assessments. The lesson leverages the quiz option to check the assignment for us.
Log into Google Drive and create a new Google Form. You can also go to https://forms.google.com to create the form. Name the form Mammals Vocabulary Quiz.

Click the Settings icon.

Remove the option to collect an email address. Enable the option to limit the response. This requires that students be logged into their account.

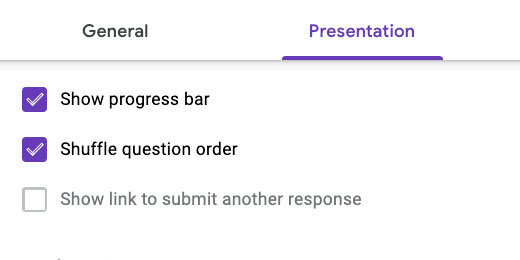
Go to the presentation section. Select the options to show the progress bar and to shuffle the question order.
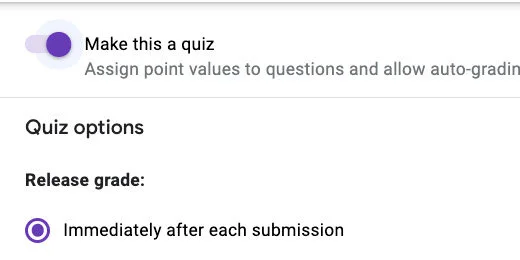
Go to the quiz section. Enable the option to make this a quiz. Click the Save button.
Click the actions menu.

Select the Preferences option.

Check the option to make all questions required. Enable the default quiz point value. I have each word in the quiz worth ten points. Choose your own point value. Click the Save button.

There are several ways to format questions. We will look at some of the options. Use more than one question format to keep things interesting.
The first question describes a mammal. This mammal has black and white stripes.

Click the question type selector. Choose a Short answer.

Click the Answer key link.

Click in the correct answer field.

Type the word zebra. Select the option to mark all other answers as incorrect. Google Forms uses these options to automatically grade the assignment. Click the Done button.

Make sure the required option is turned on for the question. Click the Add section button.

Set the name of the section to Mammals vocabulary quiz.

Click the Add question button.

Click the Insert image button next to the question field.

Go to the Google image search section.

Search for a squirrel. Select the image of a squirrel. Click the Insert button.

Type a question for the image. What is the name of this mammal?

Use Short answer for the question type.

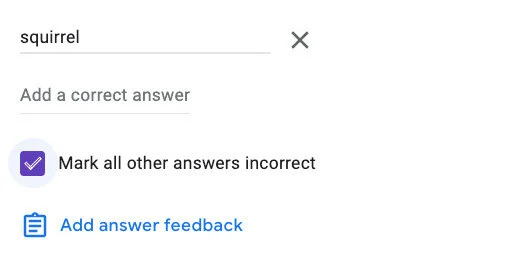
Click the Answer key link. Type squirrel for the correct answer. Select the option to mark all other answers incorrect.
There is an option to provide feedback. This feedback appears at the end when the student sees the scored assignment. This feedback is useful to reinforce their correct answer. It is also useful for students that don't answer correctly.
Go to the section module. Click the action menu. Select Duplicate section.

Click on the white space next to the image. This displays the action menu for the image.

Click the action menu. Select the option to change the image.

Go to the Google search section. Search for an elephant. Select an image and inert it.
Click the Answer key link.
Set the correct answer to elephant. Click the Done button.
Click the action menu for the section. Select the Duplicate option.
Scroll to the duplicate section and question. Click the action menu for the image. Select the option to remove the image.

Remove the question. Use a fill in the blank sentence. Use a sentence that allows students to use context clues. "The (blank) uses its long neck to reach leaves in tall trees". Change the correct answer from elephant to giraffe.

These are the three types of question prompts. I prefer to use images for vocabulary. Complete the form to create a quiz with ten questions.
Click the Preview button.

The first question appears below the name of the quiz. A progress bar appears below the question. The progress bar appears because we used sections between each question. Type the answer and click the next button.

The next question shows the image and provides space for students to enter the answer. The progress bar updates and shows we are on question 2 of 10.

Complete the quiz to make sure everything works correctly. Students can view their score at the end of the quiz. Immediate feedback is important. Research shows that immediate and meaningful feedback is important.
https://www.edutopia.org/blog/tips-providing-students-meaningful-feedback-marianne-stenger

Their score is displayed at the top of the page. This score as shown separately for each student.

Correct responses are highlighted in green.

Wrong answers show the wrong answer and the correct answer.

You might want to take the quiz again to test any changes. You need to remove the option in settings to limit the responses to 1. Don't forget to set it back when you are ready to release the quiz to students.
Geometry assignment document
In this lesson, you will create an assignment document for geometry assignments. The assignment document uses the geometry images created in other lessons. The images are free and available from my Teacher Pay Teacher storefront.

Introduction
In previous lessons, we learned to create a variety of geometric shapes and angles. In this lesson, we are going to bring them all together to provide assignments for students. The links to the shape and angle lessons are available below. A preview of the final product is also available.
Basic Geometric Shapes with Google Drawings
Preview and copy of the final product.
Area and perimeter
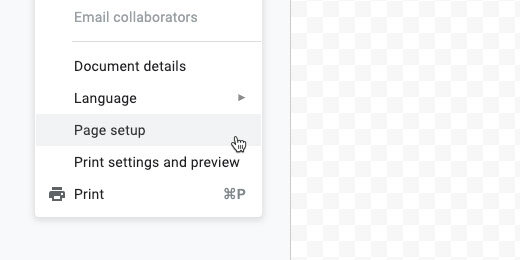
Open Google Drive and create a folder for the geometry assignments. Create a Google Document. Set the name of the document to Geometry Assignment Template. Go to the menu and click File. Select the Page Setup option.

Set the page size to Legal. Change all the margins to .5 inches. Click the Ok button. The legal size page format provides more space for the shapes. We can also use the A4 format.

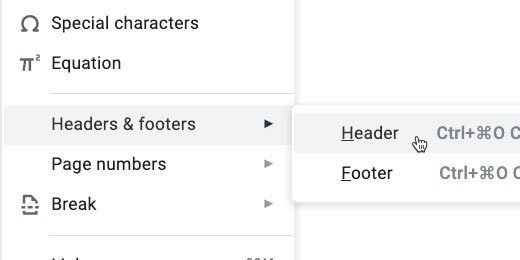
Go to the menu again and click Insert. Go to the Headers & footers option. Select Header.
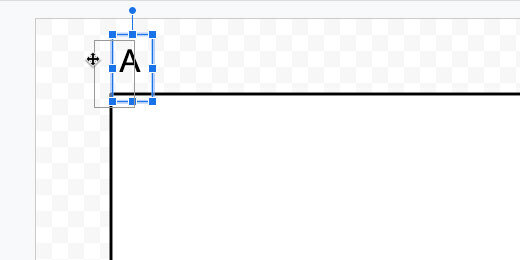
Set a title for the assignments. Provide instructions for students. I used the Title paragraph style for the assignment title. I have a coding scheme that helps me keep track of my assignments. Assignments begin with the Letter A. The letter is followed by the number of the assignment. I use Q for quizzes and T for tests. I use this information in my grade book.
This is a placeholder title. Replace it with each new assignment.
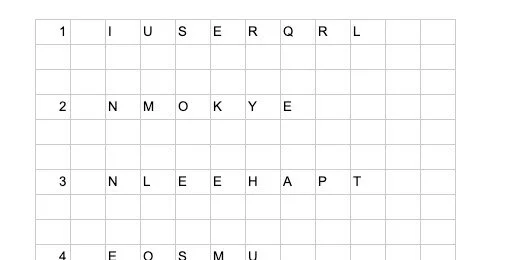
Click once in the document body. Press the Return key once. Click Insert and go to the Table option. Create a table with four columns and two rows.

The first column is used to number the problems. Type the number 1 and a closing parenthesis. Move the table column table border on the right. Move it close to the number but don't crowd it. The column needs to be wide enough to accommodate two-digit numbers.

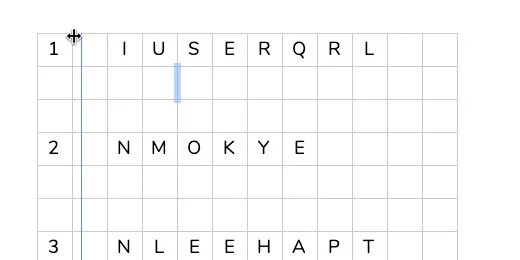
We are going to adjust the column for the shapes. Go to the ruler. Find the column marker. It is next to the right indent marker.

Move the column marker to 2.5 inches.

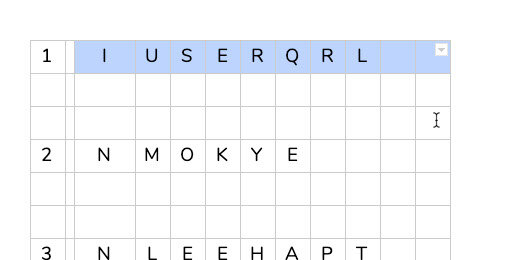
Select the last two columns in the first row.

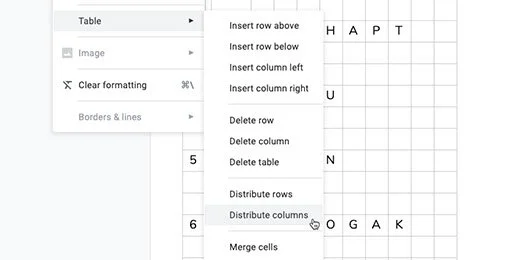
Click Format and go to the Table option. Select the option to distribute the columns.

Select the two rows in the second column.

Use Format to get to the Table option. Choose Merge cells.

Select the last two columns in the first row and merge them. This is the basic format for our geometry assignment template.

Go to the menu and click Format. Go to the table option. Select table properties.

Change the table border width to .5 points. Change the minimum row height to 2.

Click the border color selector. Select dark gray 1. Click the OK button to save the changes.

This is our basic template.

Select all the cells in the table. Click Edit and select Copy.

Click once below the table. Paste the contents.

Paste the table three more times. The fifth table is added to a second page. Keep pasting the table until there are 10. Change the numbers in each table to match the table count.

We have three pages with templates for geometry problems. The instructions from the heading are very close to the first table on each page. Double click inside the Header. Go to the end of the instructions and press the Return key once.

Using the template
The basic template is ready. I’ve shown how to do the next step in a previous lesson. The link to the lesson is available below.
Create a Template folder in the Bookmarks bar for the next step.
Go to the Chrome browser address bar.
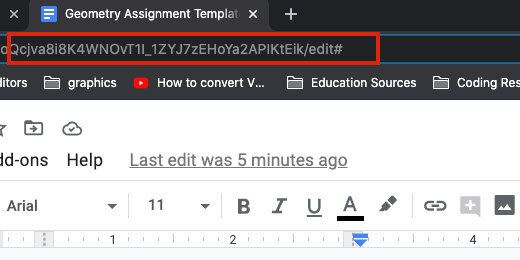
Erase Edit# and replace it with template/preview.

Go to the beginning of the document link. Click the Lock icon and drag it to the address bar.

Drop the icon over the Template folder. Make sure to wait for the folder to highlight before releasing it.

Click the folder and select the geometry assignment template.

Click the Use Template button.
The assignment
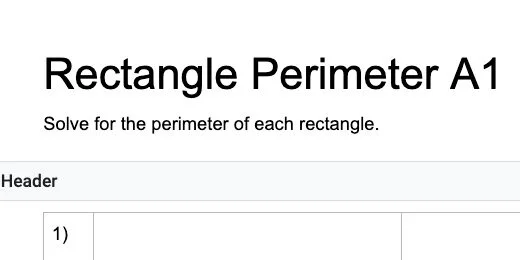
Change the name of the document. This document's name is Geometry Perimeter A1.

Double click inside the Header. Update the title to match. Update the instructions.
Click inside the second column for the first problem.
Click Insert and go to the Drawing option. Select From Drive.

Google Drive filters for all Google Drawings. Use the search box to search for the rectangle shape. Select the rectangle drawing and click the Select button.

Select the option to insert the Drawing unlinked.

The shape fills the available space between the column borders.

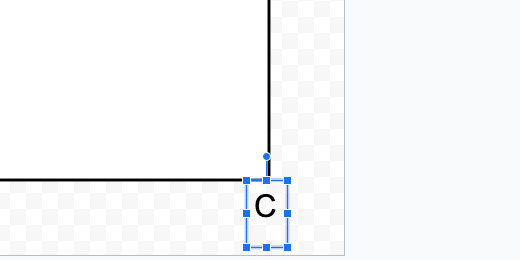
Define the problem in the main space to the right of the shape. Use the cells below the main space to mark the location for student answers.

Line segments are identified with a bar or Overline above the letters. Let’s update the instructions to include the Overline.
Erase the letters AB.

Click Insert and select Equation.

Type a backslash followed by the word overline and add a space. Type the letters AB. Like this, \overline and add a space. The word overline disappears so we can type the letters.
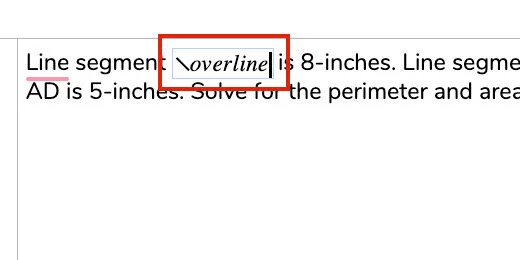
The letters AB have the overline in place to represent a line segment. Repeat the process with the other line segment.

Repeat the process to add more problems.

Solving ten area and perimeter problems might seem easy. I like to use an exercise like this to review other concepts. The measurements are given in different units of measure like inches, feet, or yards. The values include whole numbers, fractions, and decimals. I like to include ratios and percentages whenever possible. Look at the sample for an example.
Teacher master
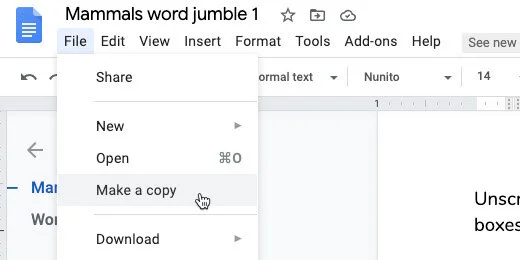
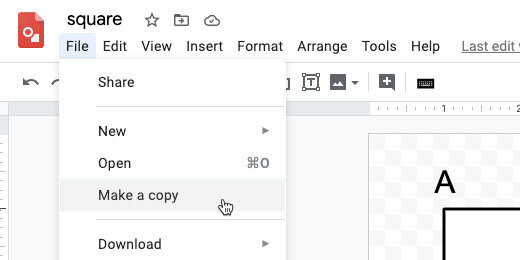
This is the student version for the assignment. We need a version for ourselves. This version contains the answer key. We need to make a copy of this document. Go to the menu and click File. Select the option to make a copy.

Erase Copy of from the name. Add Teacher Answer Key to the end. Select the assignment folder for the document. It’s a good idea to keep them both in the same folder.

Go through each problem and provide the answers. Set them apart with different font colors.

Word Jumbles with Google Sheets and Docs
This lesson teaches you how to create word jumble exercises. Word jumbles are fun activities for students. They are useful for decoding and spelling. Use word jumbles with context clues in sentences. Use them with the word definition for review. Use word jumbles with Cloze sentences. This lesson builds on the skill learned in the Word Search lesson.

Introduction
Vocabulary is such an important part of the development of language. It is important for the development of comprehension in reading. It facilitates language development. Increases communication skills. Facilitates the communication of ideas. Increases writing skills. I have a couple of links below with information on the importance of vocabulary development.
https://www.scholastic.com/teachers/articles/teaching-content/understanding-vocabulary/
https://infercabulary.com/top-5-reasons-why-vocabulary-matters/
Learning vocabulary doesn't have to be the tedious process of memorizing the spelling and definition of words. Vocabulary games like crosswords, word searches, and word jumbles provide fun ways for students to apply vocabulary skills. With these tools, students are not asked to memorize. They are applying the use of vocabulary in fun ways.
I created a set of instructions for using Google Sheets and Docs to create word search puzzles. The link is available below.
https://digitalmaestro.org/articles/word-search-puzzles-with-google-docs
In this lesson, I want to show you how to create word jumble puzzles. This lesson builds on the skills from the word search lesson. I will review the basics here for you.
A link to the final product is available below.
Click the Use Template button to get a copy.Google Docs word jumble preview and copy
This lesson is available in a printable PDF version.
Preparation
Use the link above to get a copy of the vocabulary Sheet. The sheet has three columns of vocabulary words. Teachers like to present the vocabulary in one of two ways. Some teachers like to use the words will all uppercase letters. Other teachers prefer all lowercase letters. This first step demonstrates how to covert the case of your words using Google Sheets functions.
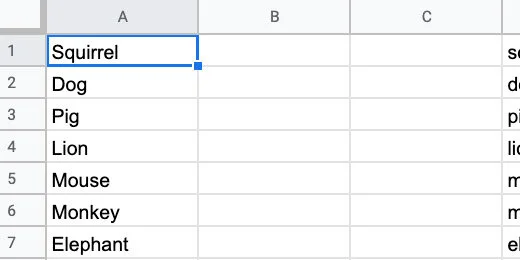
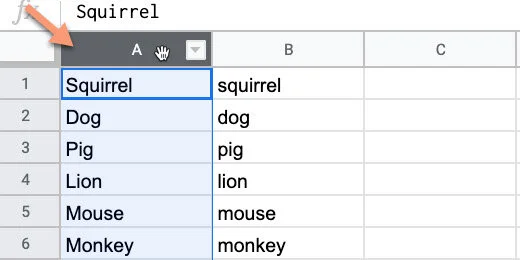
The Google Sheet has a list of vocabulary words. This word search reviews mammals covered in the lesson. In the sheet, I have the same list repeated three times. One column has the names with the first letter capitalized. The second has the letter in all upper case. The last has them all in lower case.
You can format the word search using all uppercase or all lowercase letters. The choice is yours. I want to show you how to format the words without having to retype them.
Google Sheets has plenty of useful formatting tools. I begin with Sheets when I have to deal with complex products.
Lowercase
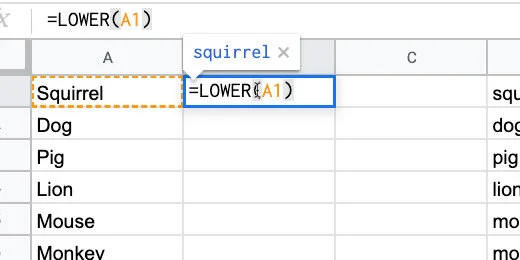
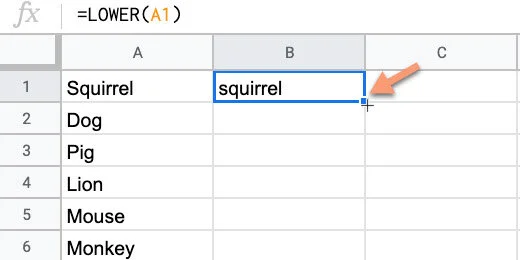
Each word begins with a capital letter in the first column. I want all the letters to be lowercase.
Click on cell B2 and type =LOWER(A1). Press the Return key to apply the formula. This converts all the letters in the word to lower case.
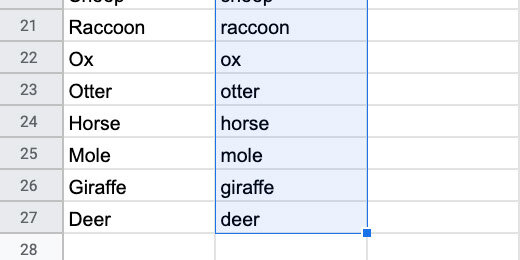
Select cell B1 again. Click the blue square in the lower right corner and drag it down.
This copies the formula down the column. Stop when you reach the end of the word list.

All the letters in each word are now lowercase.
Uppercase
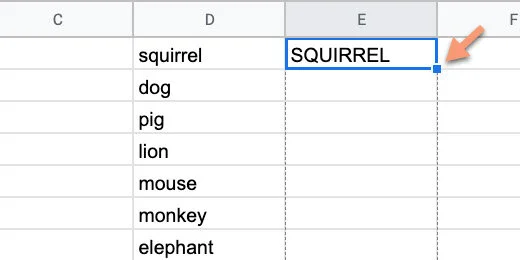
The next column has words that are all lowercase.

Click in cell E1 and type =UPPER(D1). Press the Return key.

Return to cell E1. Click the blue square and drag it down the column.
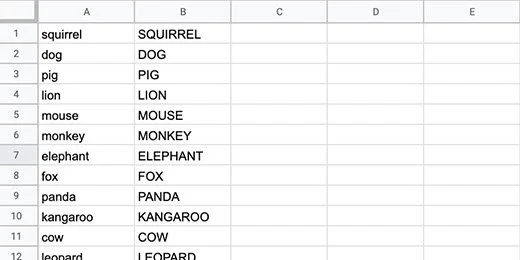
The letters in each word are transformed to uppercase.

Proper Case
Converting letters to upper or lower case it not all we can do. There is a function for converting the first letter in each word to upper case. It also changes the letters after the first letter to lowercase.
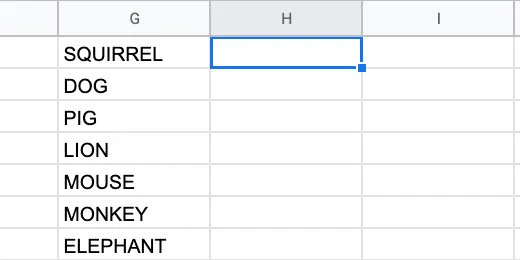
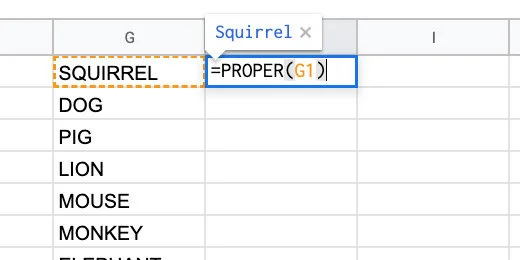
Click in cell H1 and type =PROPER(G1). Copy the function down the column.
Selecting an option
We have three options for the word search lettering. We only need one. The other options need to be removed. I am using the uppercase option.
This is how to remove the unwanted word list. Click on the column header with the word list to be removed.
Click Edit and select Delete column. The column you are deleting is identified by the column letter.

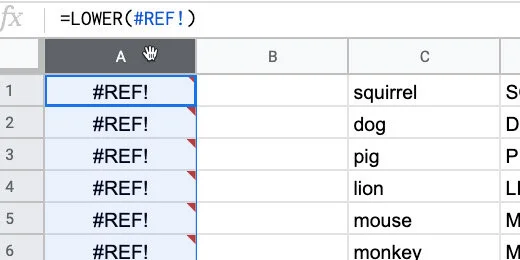
The column that used the formula to convert the letters is filled with error messages. Click the column header and delete the column.
Keep deleting columns with the word lists you don’t want to use. Your list needs to be in the first or second column. You cannot have any content to the right of the column with your words.
Segment the letters
The letters for each word need to be in separate cells. Again, we are using Google Sheets to help with this process. Sheets has a split function. We are using this function in combination with Regular Expressions. Regular expressions are a type of code used to manipulate text. It is used very often by programmers.
Click in the cell to the right of the first word. Type or paste the formula below. Replace the B1 with A1 if your words are in column A.
=SPLIT(REGEXREPLACE("" & B1,"(w)", "$1,"), ",")
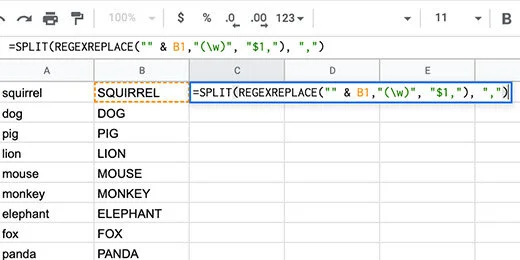
The regular expression finds each letter in the word. It adds a comma after each letter. The Split formula uses the comma to split each letter and place it on a different column.

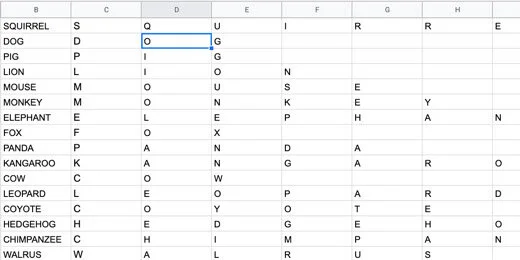
Click back on cell C1. Use the blue square to copy the formula down the column.
Random letters
Jumbled words need jumbled letters. Google Sheets has a tool to let us jumble the letters. The tool only works with words or letters listed in a column. We need to transpose the letters from rows to columns.
Create a new sheet. Click the Plus button.
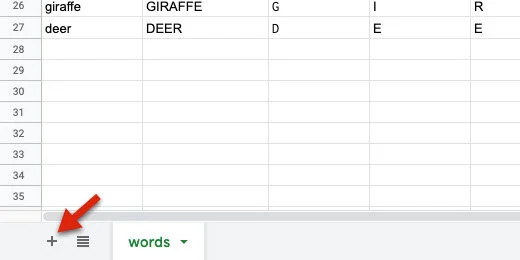
Rename the sheet Jumbles.

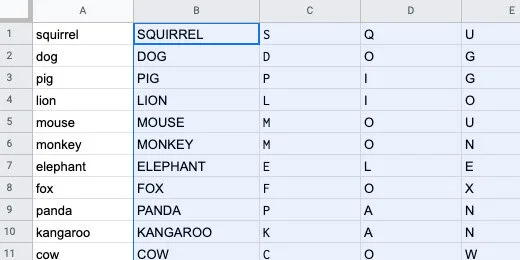
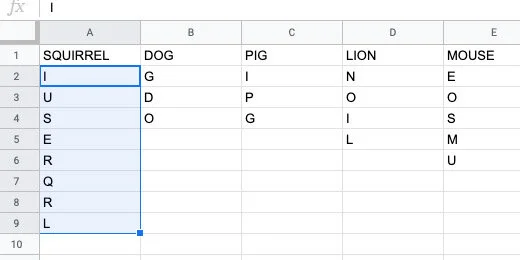
Return to the Words sheet. Select the columns with the word and the letters of the word. Make sure you select all the letters.
Go back to the Jumbles sheet. Click on cell A10.
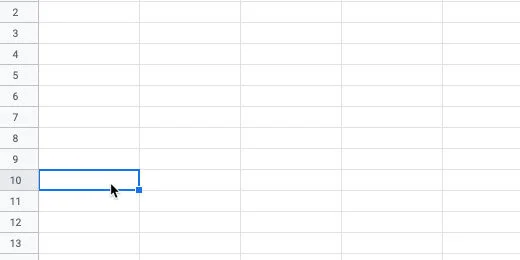
Click Edit and go to the Paste Special option. Select the option to paste the values only.
The contents are pasted and selected. Make sure the contents remain selected for the next step. Copy the pasted contents again.

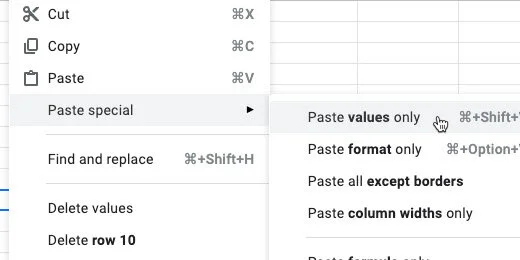
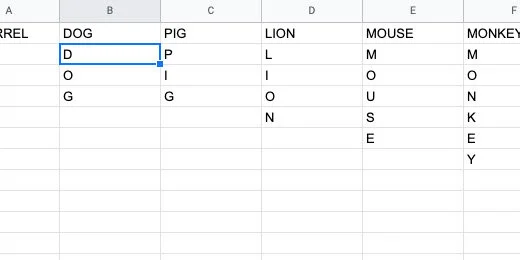
Select cell A1. Click Edit and go to the Paste Special option. Select the option to paste transposed.
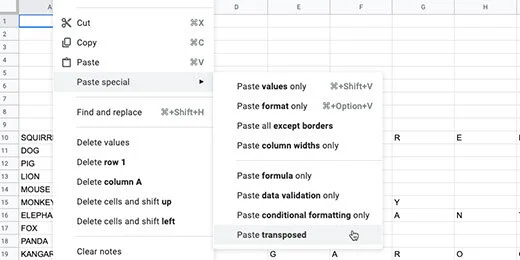
The contents are pasted so the letters go down the column.
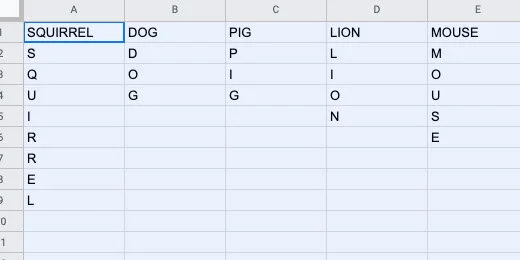
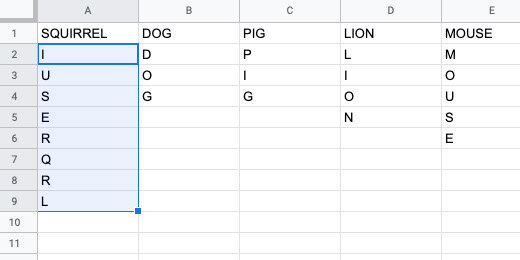
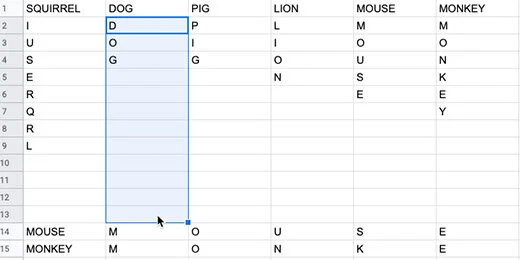
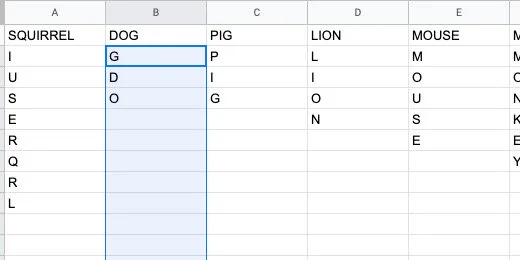
Select the letters in the column for squirrel.

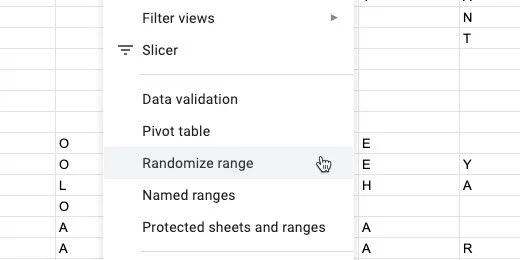
Go to the menu and click Data. Select the Randomize range option.
The letters are rearranged randomly.
We need to repeat this process for all the words. The process is easy. It can get tedious if you have lots of words. I like to use a special tool in Google Sheets to perform routine tedious tasks.
We are going to create a Macro to handle the tedious repetitive task for us. A macro records a set of steps. It then replays those steps whenever we need them.
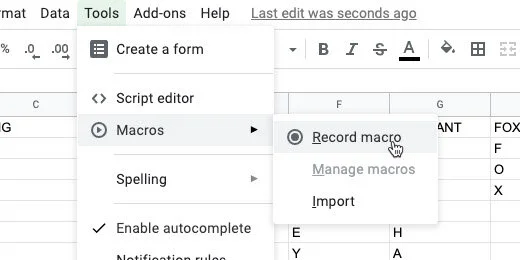
Click Tools in the menu. Go to the Macros option. Select the option to record a macro.
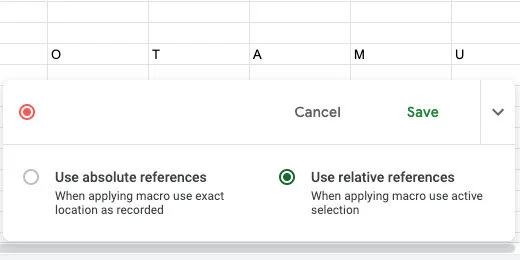
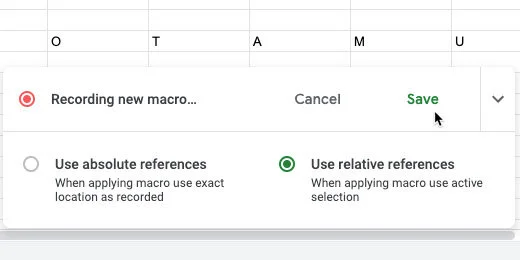
A macro recording box opens. This is not recording your screen. It is recording the selections, mouse clicks, and keystrokes. It is only recording actions taken on the Google Sheet.
Select the option to “use relative references”. This means we will be able to use the macro on any selected cells in the sheet.
Select the letter for dog. Select all the rows down to row 13. The word dog is one of the shortest words we have on the list. We want this macro to work on longer words. The longest word length goes to row 13. The letters pushed the words down from the 10th row. Click Data in the menu and select Randomize range.
Those are the only tasks we want to record. Click the Save button to stop recording.
Set the name of the macro to random letters.

There is an option to create a shortcut key combination. The combination begins with three keys. They include Command, Option, and Shift on Mac. These keys on Windows or Chromebook are Alt, Option, and Shift.
There is a blank for a number of your choosing. I like using shortcuts. They help save lots of time. I’m entering the number 0 into the number field.
Click the Save button.

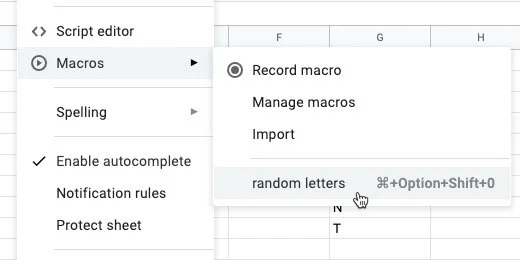
Click on the letter D in dog.
Click Tools in the menu. Go to Macros and selected the random letter macro.
The macro is a program script. The script is going to make changes to the sheet. We need to authorize the script to make changes. Click the Continue button.

Select your account when prompted. Click the Allow button.

Click on the letter D in dog again. Run the macro if the letters didn’t scramble.
Go to the next word and repeat the process. Use the shortcut key combination to go faster. Use the right arrow key to select the beginning of the next word.

Use this process to quickly jumble the letters for each word.

We can scramble the letters again. Click on the first letter of a scrambled list of letters and use the macro. This is helpful when creating more than one jumble exercise.
Range names
Ranges are a selection of cells. The selection of all the cells with letters is a range. Range names help quickly call up these cells with letters. We need to call the letters to form our word jumble puzzles.
Select the letters in the word squirrel.
Click Data and select Named Ranges.

A Named ranges panel opens. Change the named range name to squirrel. Click the Done button. Keep the panel open.

Select the next word. Go to the Named ranges panel. Click the Add a range button.

Set the name of the range to that of the word it represents. Click the Done button. Repeat this process for all the words.

The puzzle
Create a new sheet. Name the sheet puzzle.
Click the and drag along the column headers. This selects the columns.
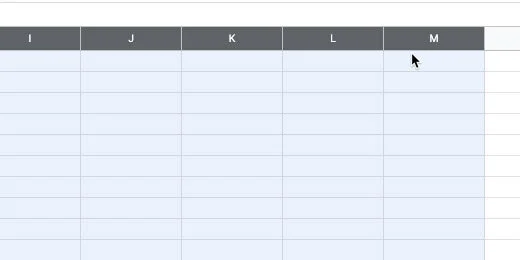
Hover over one of the columns to display a selection arrow.

Click the selector. Choose the Resize columns option. The columns A - M should be shown.
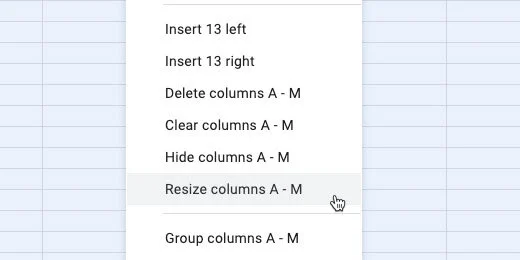
Enter 35 for the column size. Click the OK button.

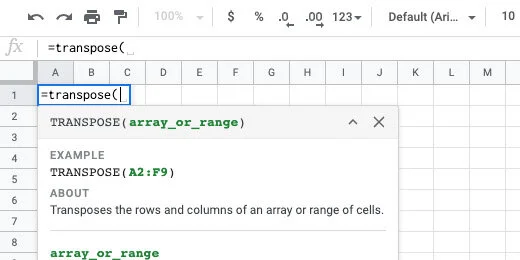
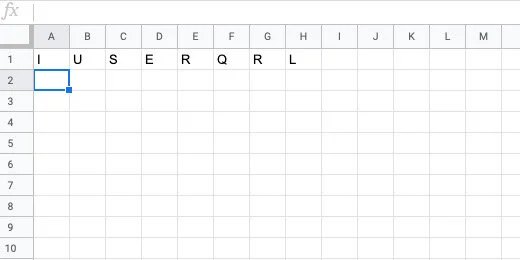
Click on cell A1. Type =transpose followed by an open parenthesis. Transpose is a function that changes the order of a range of cells. The cells in the word ranges are vertical. We need to convert them to horizontal ranges.
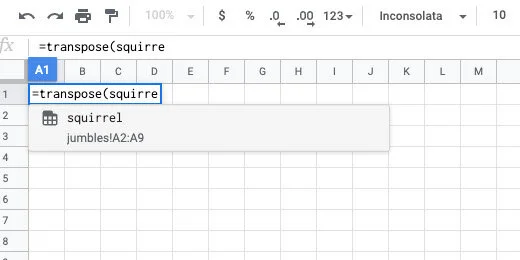
Type the word squirrel. Google Sheets provides recommendations. One of the recommendations is the named range we created. This is exactly what we want.
Finish typing squirrel. Finish it with a closing parenthesis. Press the Return key to see the result.
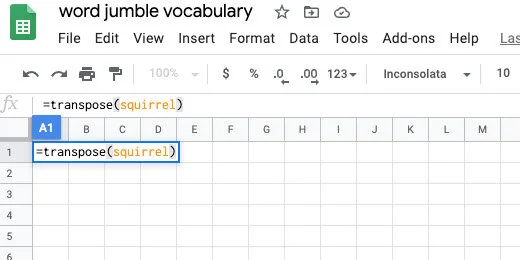
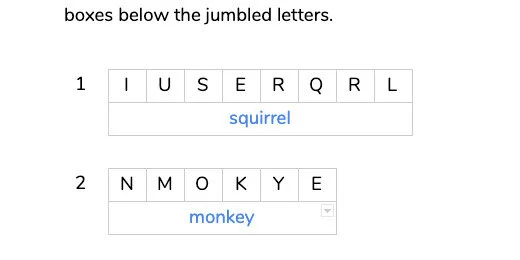
The jumbled word is placed in the row with each letter in a separate column.
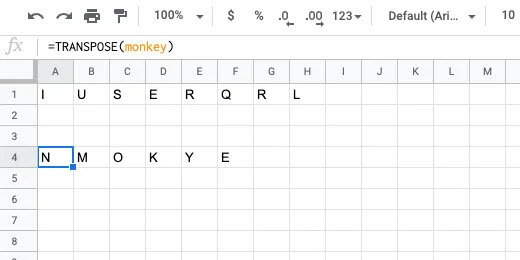
Skip two rows and type =transpose(monkey). The row below the jumbled letters is used by students to spell out the word.
Repeat the process eight more times. Choose any set of words you like.
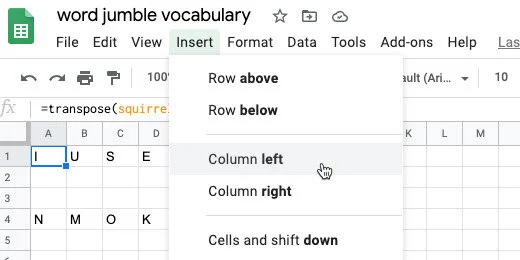
We need to prepare the table for transfer to a Google Doc. We need to number the word list. Click on cell A1. Click Insert and select Column left. Repeat the process one more time to insert two columns.
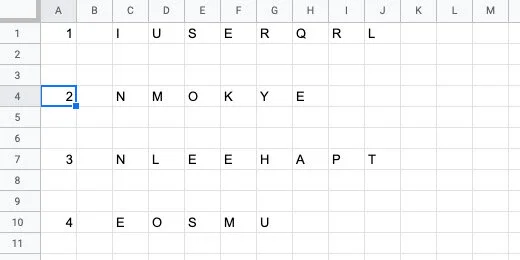
Number each word from 1 to 10.
Google Doc preparation
In the next step, we are transferring the word jumbles to a Google Doc. This document will be distributed to students.
Open a new tab and create a new document. Here is an easy way to create a new document. Type docs.new.
Change the name of the document. Name it Mammals word jumble number 1. I am assuming you will be creating additional word jumble puzzles.
Return to the Google Sheets tab. Select all the word jumbles. Click Edit and select Copy.

Go to the Google Docs tab. Press the Return key three times. This space will be used for our title and instructions later.
Paste the contents. A paste format option appears. Choose the option to paste the contents unlinked.

We need to format the contents before it is ready to distribute.
Select all the table cells.

Select a font for the word jumbles. I like Nunito normal. Change the font size to 14 points. Center align the text.

Right-click over the table to get the contextual menu. Select the Table properties option.

Set the table border at 1 point. Select middle for the vertical cell alignment. Click the OK button.

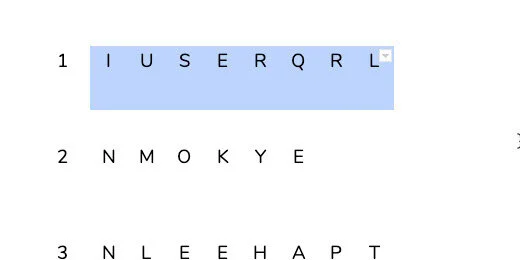
Deselect the table cells. Drag the left border of the first letter toward the numbers column. Move it as far as it will go.
Highlight all the cells in the first row beginning with the first cell with a letter.
Go to the menu and click Format. Go to the Table option. Select the option to Distribute columns.
Select all the cells in the table again. Right-click and go to the Table properties option. Change the border width to 0 points. Click the OK button.

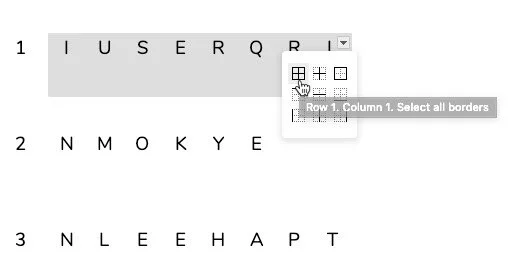
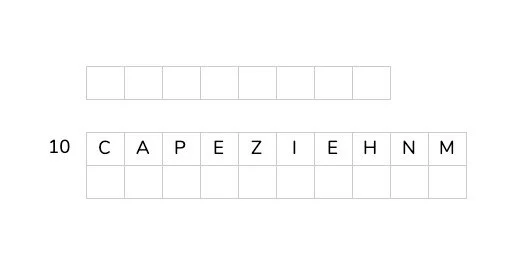
Select the cells with the letters for the first word. Include the cells in the row below each letter.
Click the border selector. Choose the all borders option. It is the first tile on the top left.
Go to the button bar. Click the border thickness selector. Choose the 1 point option.
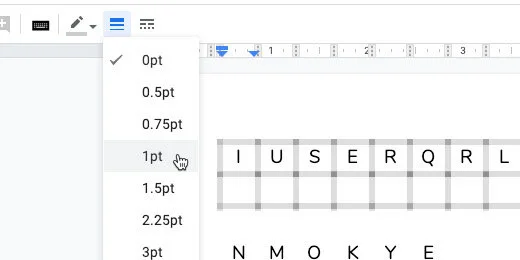
Repeat the process with the next word. Place the border around the word only. Repeat this process with all the words.
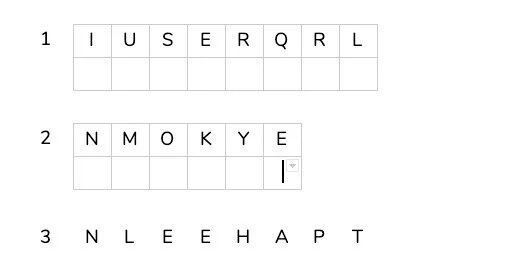
The last word does not have a row below. We need to add a row for the students to unscramble the word.
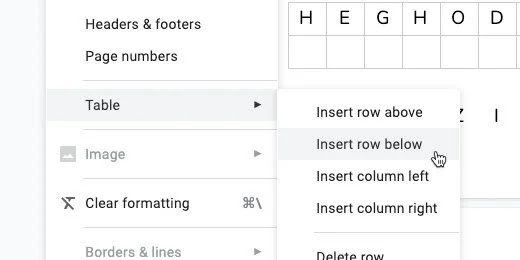
Click inside one of the cells in the last row. Go to the menu and click Format. Go to the Table option. Click Insert row below.
The last two word goes off the first page and into the next. My document has the default margins of 1-inch all the way around.
Go to the menu and click File. Go to the page setup option. Change the paper size to Legal. Click the Ok button.

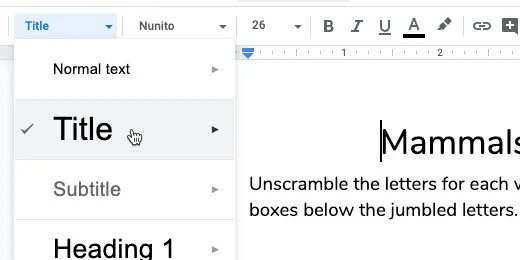
Return to the top of the page. Provide an assignment title. Include some instructions.

Use the Title paragraph style for the title.
This is the basic word jumble. There are modifications we can make to the assignment if we need to provide differentiation. This is useful for struggling learners or second language learners.
Modifications
Word clues
On the second page, I often include a small table with the words. The words are not in the same order as the jumbled versions.
Go to the bottom of the page. In the menu, click Insert and go to the Break option. Insert a Section break. Use the next page option.

Type Word Clues at the top of the page. Use the Heading 1 style for the title.
To create the table, go the menu and click Insert. Go to the Table option and select a 5 by 2 table.
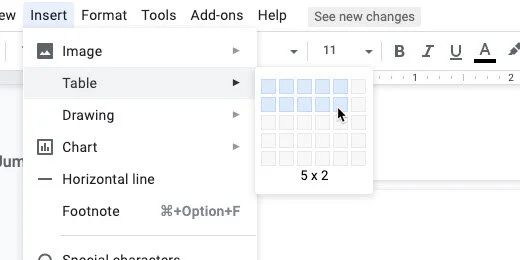
Type the vocabulary words in each cell. Place them in random locations. Center align the words in the table.

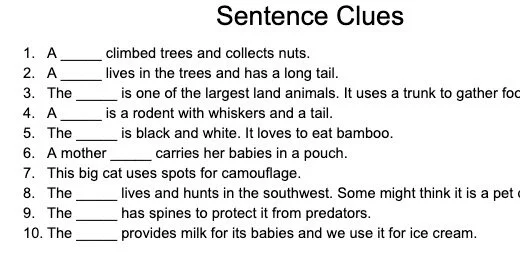
Sentence clues
Another modification option is sentence clues. The sentences provide context clues. The sentences can serve as definitions for the word.
Document outline
Using paragraph styles facilitates the use of the outline feature. Click the Outline icon.
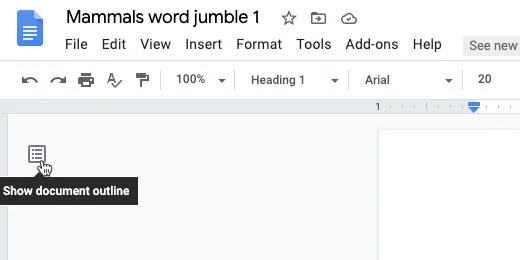
Click one of the heading titles to jump to that section. This provides a way to quickly jump from one section to the next.

Student option
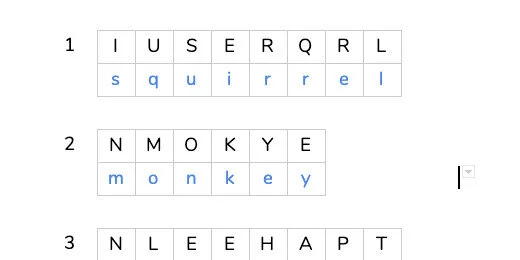
I like to include one more option for students. Select the cells below the word jumble.
Use the font color picker. Select a dark color. I’ll select blue. Repeat this for each set of cells below the word jumbles.

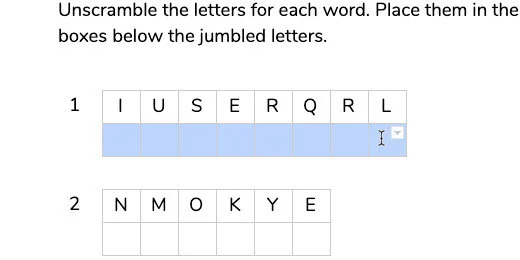
How it works
The puzzle is easy to use. Students type the letters into each cell in the correct order to unscramble the words. Being in the first cell. Type the first letter. Press the Tab key to go to the next cell. Type the next letter and repeat the process.
No tiles
You might not like the idea of entering letters into each tile or cell. You can merge the cells into one.
Select the cells in the answer row. Go to the menu and select Format. Go to the Table option. Select Merge cells.

The words will be entered normally.
The choice is yours.
This is the student master. Use it to create versions with a word list or sentence clues. Erase any answers from this version.
Teacher master
We need to create a teacher master. This master contains the answer key. It is also the version to be used when reviewing the solution with students. This makes it ideal for guided practice or review.
Click File and select Make a copy.
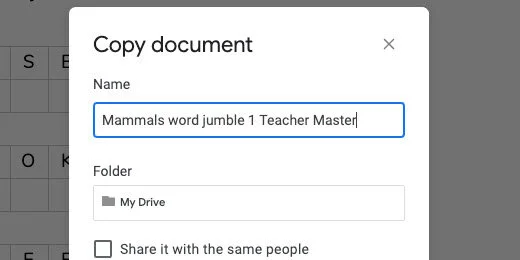
Update the name. Erase the words copy of. Append Teacher Master to the name. Click the OK button.
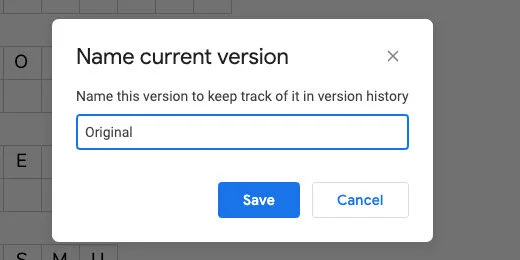
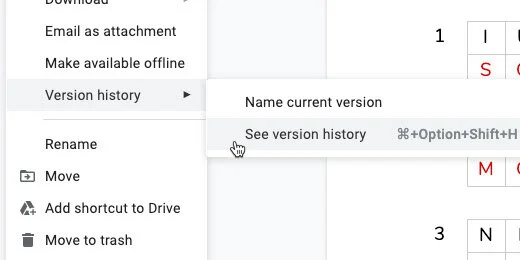
Click File and go to the Version History option. Select Name current version.

Type Original for the version name. Click Save.
Fill out the answers to the word jumbles. I like to use red to help the letters stand out. Format the answer key according to your preferences.

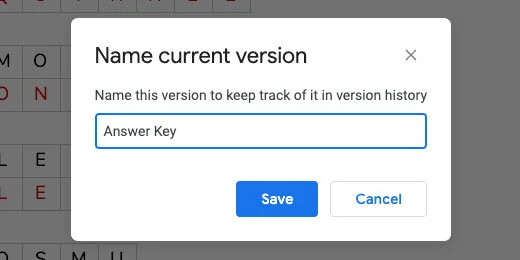
We are going to save this version with a version name too. Go to the menu and select File. Go to the Version history option. Select Name current version. Use "Answer key" for the version name.
Original and answer key
This is how you switch between the versions. Go back to the Version history option. Select See version history.
Enable the option to Only show named versions. You will see the versions we created.

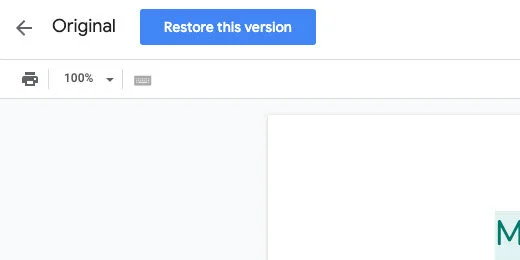
Click the Original version name.

Click the Restore this version button. Click the Restore button when prompted to confirm.
This version is saved and the document can be restored to this format at any time. Go ahead and solve the word jumbles on your own. Repeat the process above to restore the original version. Your changes will be removed and the document restored without any answers.
I like using this process when doing a guided practice with students.
Use the answer key to show students the answers. Use it to quickly check student work.
Make a cone shape with Google Drawings
Geometry isn't only about 2D shapes and angles. It includes 3D shapes. Representing 3D shapes on 2D surfaces like screens and paper is difficult. We can use orthographic projection to represent 3D objects in 2D space. There are different methods for representing 3D objects.

Introduction
Geometry isn't only about 2D shapes and angles. It includes 3D shapes. Representing 3D shapes on 2D surfaces like screens and paper is difficult. We can use orthographic projection to represent 3D objects in 2D space. There are different methods for representing 3D objects.
One method used in technical drawings is isometric projection. Another familiar perspective is a Cabinet graphical projection. Cubes are often represented using this projection. Artists often use perspective projections. This is common with buildings and landscapes. There is a family of graphical projections. The images below represent some of these projection groups.
Use the links below to get a copy of this final product or to see a preview.
See a preview of the final product
Cone
Google Drawings has plenty of shapes to help with geometry. It has a couple of 3D shapes. It does not have spheres or cones. In this lesson, we are creating a cone shape.
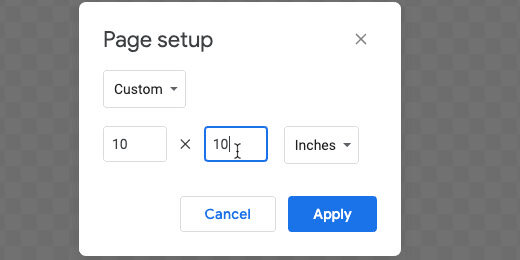
Create a Google Drawing document. Click File in the menu and go to the page setup option. Set the width and height to 10 inches. Rename the drawing cone.
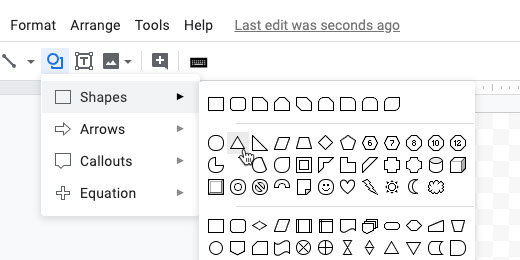
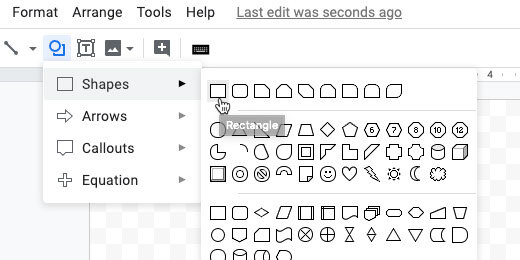
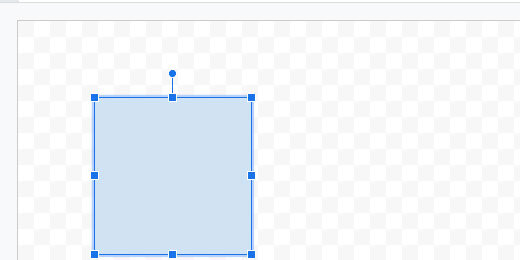
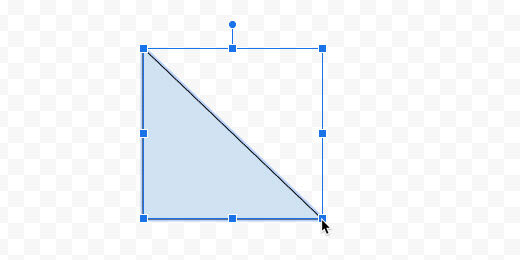
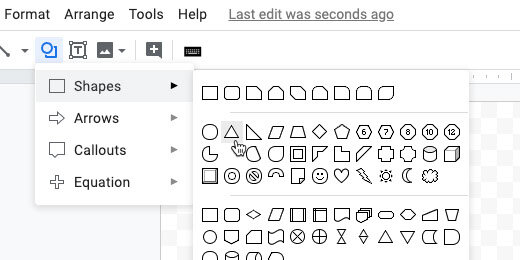
Select the triangle tool from the shapes selector.
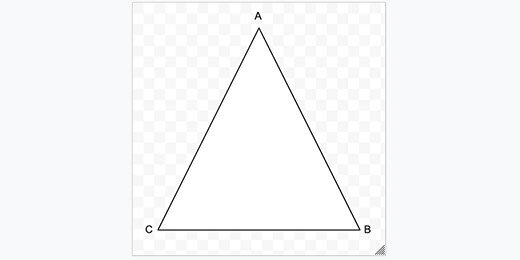
Drag out a basic triangle.
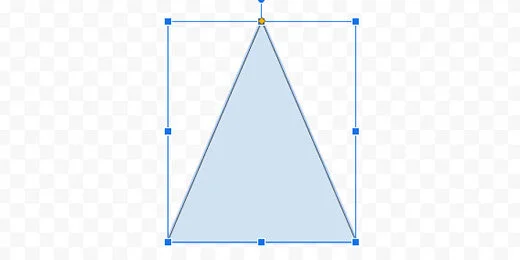
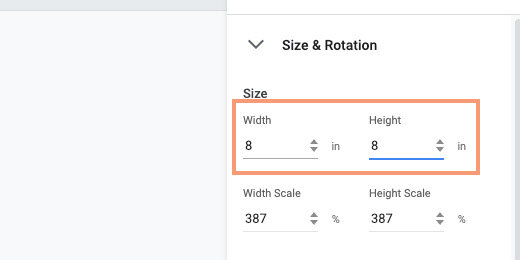
Click the Format options button in the button bar. Select the size & rotation section in the format options panel.

Set the width to 6-inches and the height to 7-inches.

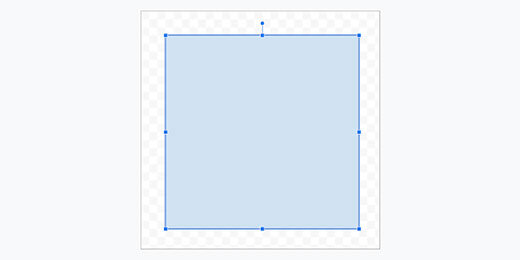
Drag the shape to the center of the canvas. Use the alignment guides.

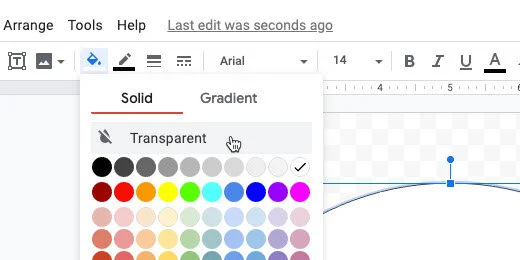
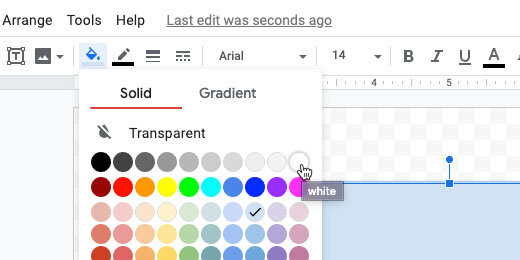
Change the fill color. Choose white.

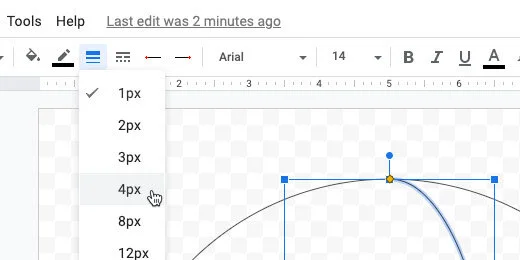
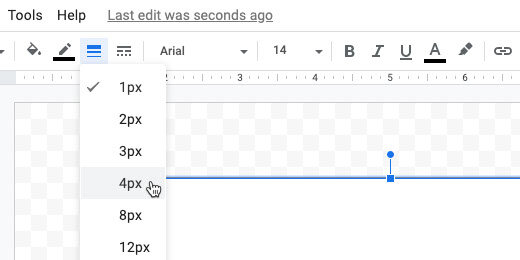
Change the line thickness to 3 pixels.

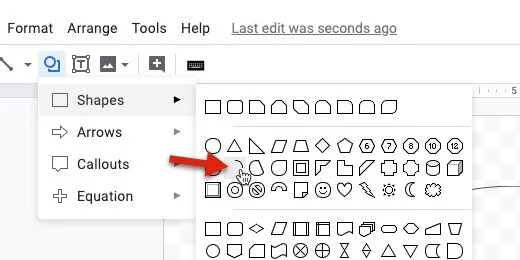
Select the oval tool. Create a small oval next to the triangle.

Move the oval to the bottom of the triangle. Use the alignment guides to center the oval.

Stretch the left side of the oval. Align it to the left angle of the triangle.
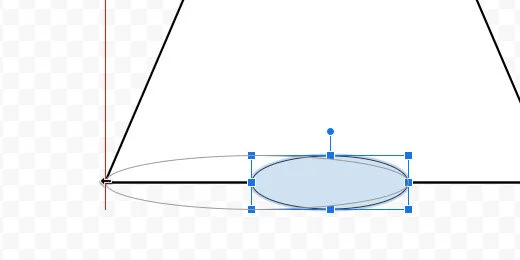
Stretch the right side of the oval. Align it to the right angle of the triangle.
Change the oval fill color to white.
Change the border color to a dark gray.
Change the line thickness to 3 pixels.
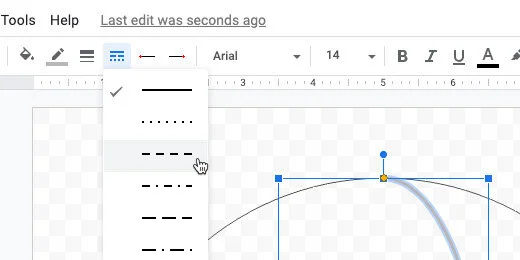
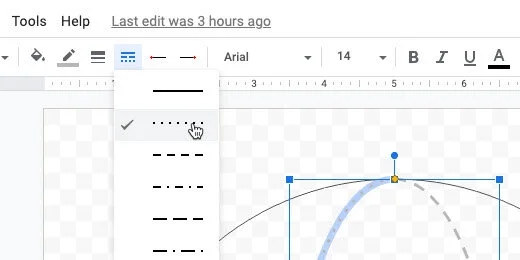
Set the line style to dashed.
Select the triangle. Click Arrange and go to the Order option. Select the option to bring it to the front.

Each shape is placed on a layer. The triangle was the first shape so it was placed on the first layer. Each new layer is placed above the first. The oval was placed on the second layer. The operation we just performed brought the triangle layer to the top. Part of the oval has disappeared below the triangle.
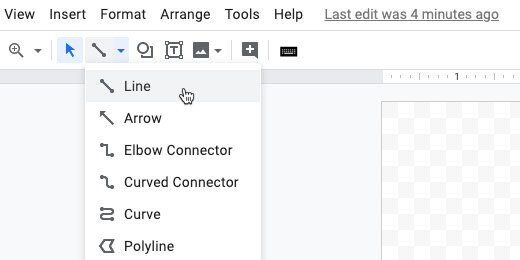
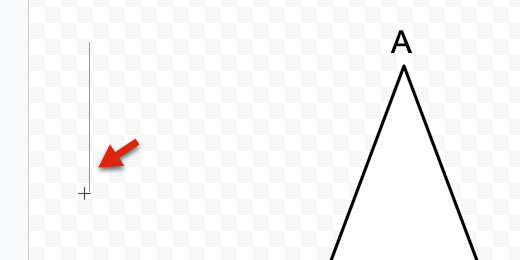
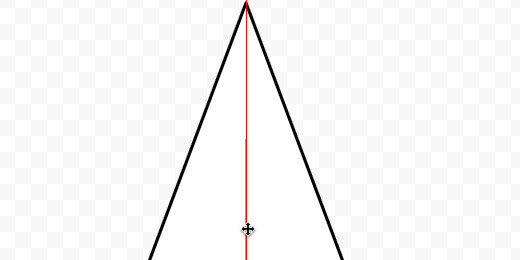
Select the line tool and create a small vertical line next to the triangle. Use the Shift key to create a straight vertical line.

Set the line thickness to 4 pixels. Choose dotted for the line style. Select orange for the line color. Move the line to the top of the triangle. Use the alignment guides to center the top of the line to the top of the triangle.

Drag the line’s bottom to the bottom of the triangle. Use the purple anchor point to attach the line to the triangle.
Click on the triangle. Go to Arrange and then to the Order option. Select Send to back.
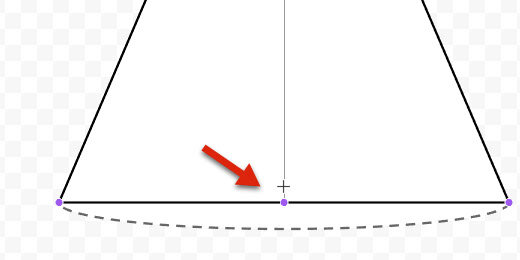
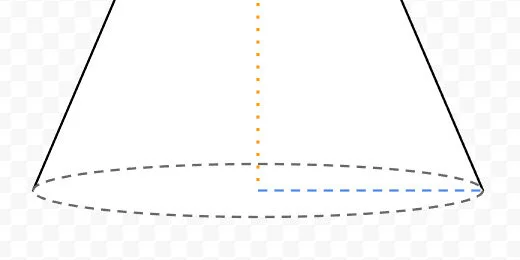
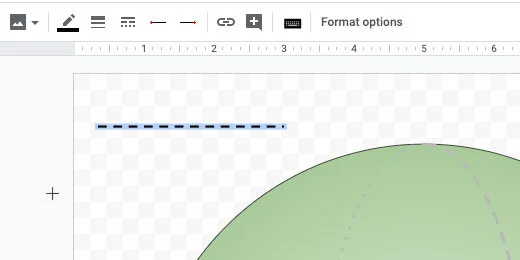
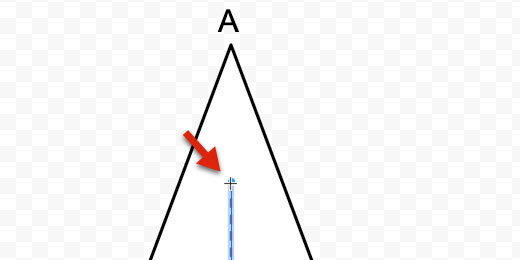
Create a horizontal line. Place it next to the triangle. Change the line thickness to 3 pixels. Change the line color to blue. Change the line style to dashed. Move the line to the bottom of the cone. Align the left side to the orange line. Align the line itself to the center of the oval. Use the alignment guides.

Connect the right side of the line to the edge of the oval on the right.

The blue line represents the radius of the base.
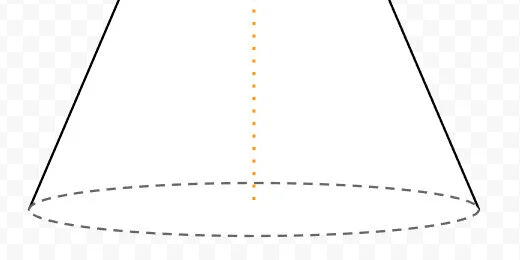
Select the arc tool from the tools selector.

Draw a small arc next to the triangle. Use the Shift key to keep the arc symmetrical.

Drag one of the arc anchor points to form a circle. Don’t complete the circle. Leave a small gap.
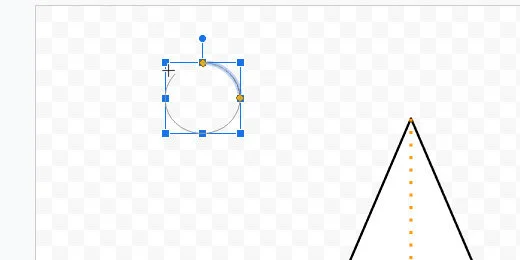
Drag the arc to the bottom of the cone. Align it to the center of the oval.

Stretch the left side of the arc to the left edge of the oval.

Stretch the other end of the arc to the right side of the oval.
We need to align the arc to the oval. The arc will be directly over the oval. Hold the Option key and drag the bottom resize hand toward the oval border. The option key keeps it centered while it is resized.

Drag the left arc anchor point to the left. Place the yellow anchor as close as you can to the edge of the oval and the angle of the triangle.

Repeat the process for the other arc anchor point.
Change the arch line thickness to 3 pixels. Set the line style to solid. This completes the illustration.

Make a sphere with Google Drawings
Geometry isn't only about 2D shapes and angles. It includes 3D shapes. Representing 3D shapes on 2D surfaces like screens and paper is difficult. We can use orthographic projection to represent 3D objects in 2D space. There are different methods for representing 3D objects.

Introduction
Geometry isn't only about 2D shapes and angles. It includes 3D shapes. Representing 3D shapes on 2D surfaces like screens and paper is difficult. We can use orthographic projection to represent 3D objects in 2D space. There are different methods for representing 3D objects.
One method used in technical drawings is isometric projection. Another familiar perspective is a Cabinet graphical projection. Cubes are often represented using this projection. Artists often use perspective projections. This is common with buildings and landscapes. There is a family of graphical projections. The images below represent some of these projection groups.
Use the links below to get a copy of this final product or to see a preview.
See a preview of the final product
Sphere
Google Drawings has some 3D shapes. These shapes include the cylinder and cube. It does not have a sphere or a cone. We will create a sphere.
Create a folder to store the geometric shapes. I have my 3D shapes folder within a geometry folder. That folder is within an assignment folder. Go into that folder to create the sphere.
Go to your Google Drive and open the folder where the Sphere will be saved. Create a new drawing document. Set the document name to Sphere. Click File and go to the page setup option.

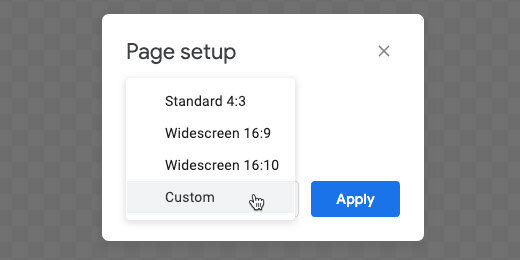
Select the custom option from the page setup selector. Set the width and height to 10-inches. Click the apply button.

Click the shapes selector. Choose the oval tool.

Drag out a circle shape. Press the Shift key on your keyboard to constrain the shape to a circle. The circle doesn’t have to be large.

Go to the button bar and click Format options. Click the Position section. Set the X and Y position values to 1-inch.

Select the size & position section. Set the width and height values to 8-inches.

Use the shape color fill tool and choose the Transparent option.
Select the arc tool from the shapes selector.
Draw a small arc shape outside the circle area. Press the Shift key to create a symmetrical arc.

Use one of the yellow anchor points to trace a circle. Don’t complete the circle. Leave a small gap.

Move the arc shape to the top center of the circle. Use the alignment guides to help align the shape.

Drag the bottom resize handle down.

Release the shape when it touches the opposite end of the circle.

One of the yellow anchor dots should be somewhere within the circle. Click and drag the yellow dot down to the bottom of the circle.

The yellow dot should be touching the bottom of the circle.

The other yellow dot should be touching the top of the circle.

Open the size & rotation option. Set the width of the arc to 3-inches. Make sure the height is set to 8-inches.

Changing the size moves the arc slightly off-center. Drag the arc toward the center of the circle. Use the alignment guides.

Change the arc line color to a light gray.

Change the line thickness to 4 pixels.
Set the line style to dashed.
Click Edit and select Duplicate.

Click Arrange and go to the Rotate option. Select Flip horizontally.

Drag the duplicate shape and center it within the circle.

Change the line style. Use the dotted line style.
The next step is optional. Try it out so see if is something you want for your sphere.
Select the circle.

Click the color fill selector. Switch to the gradient section.
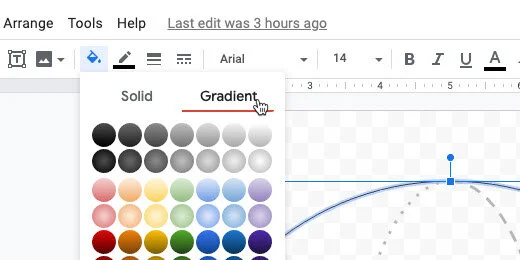
Choose a gradient from the fourth row.

You don’t have to give the sphere a gradient color. I think it adds some depth. The next step creates the diameter and radius lines.
Select the line tool. Draw a horizontal line outside the circle. Hold the Shift key to keep the line horizontal.

Change the line thickness to 3 pixels. Change the line style to dashed. Press the ESC key to deselect the line.
Move the line to the center of the circle. Use the alignment guides.

Drag the right anchor to the edge of the circle. Connect it to the anchor that appears at the edge. Repeat the process for the other end of the line.

We are going to duplicate this line. Click Edit and select Duplicate. Drag the right endpoint up. Connect it to one of the connectors on the circle above the diameter line.

Drag the other end of the line. Connect it to the center connector on the diameter line.

Click the Textbook button. Click outside the sphere. Type the capital letter D in the box. Resize the textbook. Place the letter where the radius line meets the diameter line.
Create another text box. Type a lower case letter r. Resize the box and position it next to the radius line.

Measuring angles with a protractor in Google Drawings
In this lesson, we are creating graphics for geometry angle assignments. The images are used by students to measure angles. Students use the image of a protractor to help them measure these angles.

Introduction
In this lesson, we are creating graphics for geometry angle assignments. The images are used by students to measure angles. Students use the image of a protractor to help them measure these angles.
The angles we are using here are based on a previous lesson. Use the link below to review that lesson.
I am providing the finished product links below. Use them if you don’t want to create the angles from scratch. Each link creates a copy of the angle in your Google Drive.
The angles are available on my Teacher Pay Teacher storefront. They are free. The link to the storefront is available below this paragraph. I encourage you to follow along in the lesson. The point of the lesson is to learn new skills.
Create basic angles with Google Drawings
The protractor
Students need a protractor to measure the angles. There is a free image resource available from Wikimedia Commons. This image is in the public domain. The link to the image on Wikimedia is available below. I also have a copy of the protractor available in a Google Drawing.
Don't download the image from the Wikimedia page. We will use the link to directly insert the image into a drawing.
https://upload.wikimedia.org/wikipedia/commons/5/5b/Gradeboog1.png
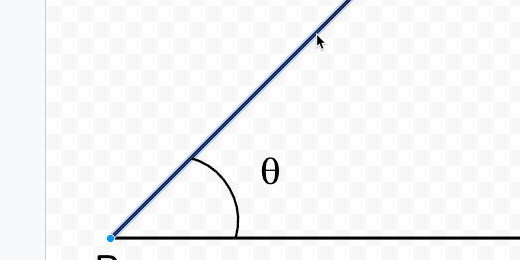
Vocabulary
Geometry and angles have their own set of vocabulary. Here are the terms used in this lesson.
Vertex is the point where line segments meet at an angle.
An arm is a term used for the lines of an angle.
An angle is where the arms meet in a vertex.
An initial side is an arm that lies flat on the x-axis.
The Terminal side is the arm that is opposite the initial side.
Theta is the symbol used for angles.
Acute angles
Open the acute angle drawing. Use the link above to get a copy. Make a copy of the Drawing. Click File and select Make a copy.

Set the name of the copy to 15-degree angle. Click the OK button.

The image in the drawing is grouped. I recommend grouping the objects to prevent students from accidentally moving objects out of place. We need to ungroup the objects to create the angle.
Click once on one of the lines. Click Arrange and select Ungroup.
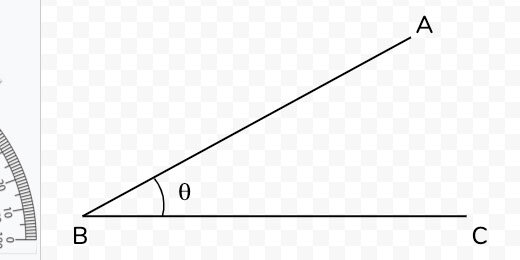
Press the ESC key on your keyboard or click once outside the angle to deselect the objects. Click on the Terminal arm.

We are going to change the angle of the line. To change the angle we need to rotate it to 90-degrees. Click and drag the terminal line endpoint to the left. We want the line to be straight up and down. Hold the Shift key will moving the endpoint. This forces the line into a perfectly vertical position.

The line needs to be at a 90-degree angle.

Hold the Shift key and drag the line endpoint to the right. The line will snap as you move it to the right. The line snaps at 15-degree increments.

Keep moving the endpoint down. Stop when the line snaps to a point before it reaches the initial arm.

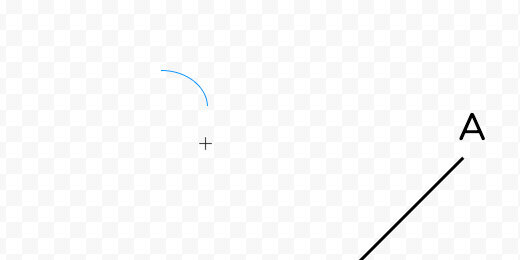
This is our 15-degree angle. We need to clean up the letters and symbols. Select the arc symbol. Move the top arc endpoint toward the terminal arm. Use the plus symbol to align the endpoint.

Reposition the letters and the Theta symbol.

Draw a selection around all the objects. Click Arrange and select Group.
Move the angle toward the center of the canvas. Use the alignment guides to center the angle.
The protractor
We need to supply the protractor for students to use. Go to the beginning of this lesson and copy the link to the image.
Click Insert and go to the Image option. Select the option to insert an image by URL.

Paste the link into the URL box. The image of the protract appears in the preview box. Click the Insert button.

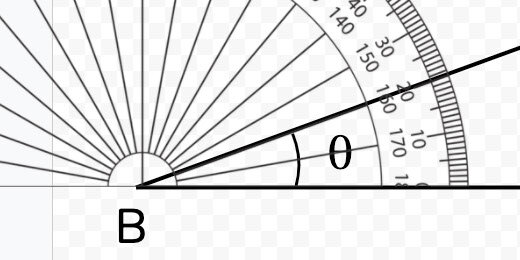
Measuring the angle
This is what students will do. Drag the protractor so the 90-degree mark is at the vertex. The image disappears as we drag it. Place the image close to the vertex. Use the up, down, left, and right arrow keys to position the image.

The terminal line lies on the 15-degree mark.

Adjusting the protractor
The protractor and the line are the same color. It might be difficult for some students to determine the reading.
Select the protractor image. Click the Format options button. Select the Recolor section.

Click the recolor selector. Choose a color.

The color provides added contrast.

There is another option to increase contrast. Open the Adjustments section. Move the transparency slider to the right. Move it somewhere close to the midway position.

The terminal line of the angle is easier to see.

Place the protractor to one side of the drawing. Students will drag it onto the drawing.

Distribute a copy of the angle to students using Google Classroom.
More angles
There are many more angle options. Make a copy of this drawing. Set the name of the copy to 30-degree angle.
Select the angle and ungroup the objects. Click the terminal line endpoint. Hold the Shift key. Move the endpoint up and to the left. It will snap to the next 15-degree point.
Adjust the letter for the endpoint. Move the endpoint for the arc to meet up with the terminal line. Adjust the Theta symbol. Select all the objects and group them. This prevents students from accidentally moving the objects separately.
Different angles
We have been making angles with increments of 15-degrees. Let’s make an angle for 20-degrees.
Make a copy of the drawing. Set the name to 20-degree angle. Select the angle and ungroup the shapes. Select the terminal line. Open the Format options panel. Select the Size & rotation option.
The shape can only be rotated clockwise. Shapes are always set to zero degrees when created. Rotating a shape counterclockwise is not possible using the rotation setting.
The terminal line is 30-degrees from the initial line. Rotate the angle 10-degrees to return to 20-degrees.

The shape rotates about the center. This causes the endpoint to move from its connection with the initial line.

Drag the rotated line down until the endpoint aligns with the initial line.

Adjust the arc and move the Theta symbol.
Move the protractor image in and measure the angle.
Move the protractor back to where it was.
Draw a selection around the objects. Group the objects. Center the angle on the canvas.
More angle options
I like to begin with the right angle for most angles. Make a copy of the angle we created. Name the new drawing 60-degrees. Ungroup the angle. Select the terminal line. Drag the top endpoint to the left. Use the shift key to form a vertical line.

Open the Format options panel. Open the Size & Rotation section. To create a 60-degree angle we need to subtract the difference from 90-degrees. That gives us 30-degrees. Enter 30-degrees in the degrees field.

Move the terminal angle and align it with the initial line endpoint.

Adjust the arc and reposition all the text boxes.

Obtuse angles
We create obtuse angles using the same process. We need an obtuse angle to get started. Use the link below to get a copy of a basic obtuse angle drawing.
Get a copy of the obtuse angle.
Make a copy of the angle. Name the copy 140-degree angle. Ungroup the objects. Select the terminal line.
Move the top endpoint so the line is horizontal. Remember to use the Shift key.

Click the Format options button. Open the Size & Rotate section. We need to subtract 140-degrees from 180. This leaves 40-degrees. Enter 40-degrees in the angle field. Move the line and align it with the horizontal line endpoint.

Rearrange the text boxes. Group all the objects and center the angle on the drawing canvas.

The process isn't too difficult. I hope you find these instructions useful.
Angles with Google Drawings
In this lesson, you will learn how to create a variety of angles with Google Drawings. Use the angles to teach and assess student knowledge of various angles. We will create a right, acute, and obtuse angles. Samples of the angles are available for your Google Drive account.

Introduction
In this lesson, you will learn how to create a variety of angles with Google Drawings. Use the angles to teach and assess student knowledge of various angles. We will create a right, acute, and obtuse angles.
The angles are available for you to copy and use without going through the lesson. I do encourage you to go through the lesson to learn a few skills. The links are available below.
right angle
acute angle
obtuse angle
Vocabulary
Geometry and angles have their own set of vocabulary. Here are the terms used in this lesson.
Vertex is the point where line segments meet at an angle.
An arm is a term used for the lines of an angle.
An angle is where the arms meet in a vertex.
An initial side is an arm that lies flat on the x-axis.
The Terminal side is the arm that is opposite the initial side.
Theta is the symbol used to identify angles.
Preparing the Drawing
Open Google Drive. Make sure to create a folder to store the drawings. Mine is stored inside an assignment folder. This folder has a math folder. Inside that folder, I have a geometry folder. In that folder, I have a folder for the angle drawings. I also have folders for my 2D and 3D shapes.

Click the New button to create the Drawing document.

Set the name of the drawing to a 90-degree angle.

Click File and select Page Setup. Click the page selector and choose Custom. Set the page size to 10 by 10 inches. Click the Apply button.

Select the Line segment tool from the line selector.

Draw a horizontal line on the canvas. Press and hold the Shift key to create a perfect horizontal line.

Click the Line weight selector. Choose the 4 pixels.

Press the ESC key to exit the line segment tool. Make sure the line is still selected. Click Edit and select the Duplicate option.

Click the Format options button.

Open the Size and Rotation section in the format options panel. Click the Rotate 90-degree button.

Drag the vertical line to the left edge of the horizontal line. Use the red alignment guides to position the top of the vertical line with the left side of the horizontal line. The lines need to be at right angles to each other.

Drag the horizontal line to the bottom. Align it to the right.

Draw a selection around both lines. Click Arrange and select Group.

Go to the Size & Rotation section. Change the height and width to 8 inches.

Open the Position section. Set the position for X and Y to 1-inch.

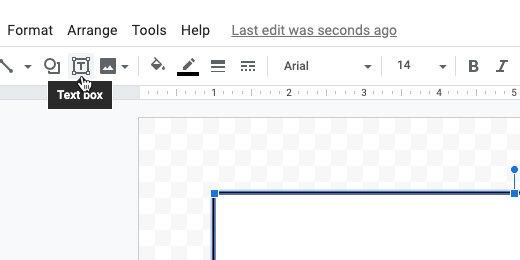
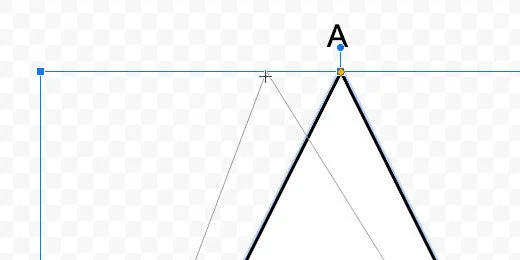
Click the Text-box tool.

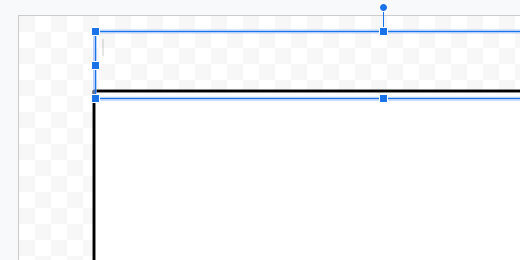
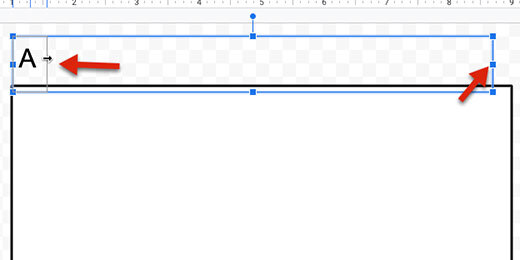
Click once in a space above the angle. Type the letter A. Change the font size to 36 points. Resize the text box. Place it above the vertical line.

Click Edit and select Duplicate. Move the duplicate letter to the bottom. Change the letter to B.

Duplicate the text box. Place it to the right of the horizontal line. Change the letter to C. The letters are used to reference the angle in questions.

We will use this angle to create other angles.
Acute angle
Click File and select Make a copy.

Change the name of the drawing to an Acute angle. Click the OK button. Select the vertical line. Click the Format options button. Open the Size & Rotation section. Click in the angle field. Change the angle to 45-degrees.

Drag the rotated line to the horizontal line. Align the ends of each line. Use the alignment guides.

Move the letter A. Place it above the angled line. Drag a selection around all the objects. Click Arrange and select Group.
Click the line and drag the shape toward the center. Use the alignment guides to center the angle vertically and horizontally.

This will serve as our template for future acute angles. Before creating more angles we need to take care of a couple more items.
Click the shapes selector. Choose the arc tool.

Draw an arc on the canvas. Hold the Shift key to create a symmetrical arc. Don’t make the arc too big.
Move the arc down to the angle.

Open the Formatting options panel. Rotate the arc 15-degrees.

Move the arc so the endpoints touch the arms of the angle. Change the arc line thickness to 3 pixels.

Theta symbol
We need a symbol for the angle. This symbol is Theta. Open another tab and go to https://math.typeit.org. Click on the Theta symbol. It looks like the number zero with a horizontal line through it. The symbol is placed in the text area.

Select the symbol in the text area and copy it. Return to the drawing tab. Paste the symbol. A text box is created to hold the Theta symbol.

Set the font size to 36 points. Resize the text box to surround the Theta symbol. Move the text box. Place it within the angle.

Obtuse angles
Make a copy of the acute angle. Set the name of the copy to an obtuse angle. Select the angle. Click Arrange and select Ungroup. Deselect the shape. Select the diagonal line.
Open the Format options panel. Click the Flip horizontal button.

Move the inverted diagonal line to the left. Align the endpoint with the horizontal line.

Drag the arc closer to the vertex. Drag the top arc endpoint to connect with the terminal side.

We are going to select the arms and the arc. Hold the Shift key and click on each arm.

Click Arrange and select Group. Go to the Resize & Rotation panel. Set the width to 8-inches. Set the height to 4-inches. Move the obtuse angle to the center of the canvas. Reposition the letters and the Theta symbol.

Basic geometric shapes with Google Drawings
In this lesson, we will be learning how to create basic geometric shapes. Use the shapes in assignments and assessments. The shapes are created using Google Drawings. The tools in Drawings makes the process of creating the shapes simple.

Introduction
In this lesson, we will be learning how to create basic geometric shapes. Use the shapes in assignments and assessments. The shapes are created using Google Drawings. The tools in Drawings makes the process of creating the shapes simple.
The final products in this lesson are available and free on my Teacher Pay Teacher store. I have created some free assignments and assessments for you. They are on my Teacher Pay Teacher storefront. Use the links below to access those resources. I encourage you to go through the lesson and create the shapes yourself. The process adds to your skillset.
Google Drawing shapes on Teacher Pay Teacher
Google Drawings
Create a folder in your Google Drive to store the geometric shapes. Here I have my geometry folder inside my assignments folder.
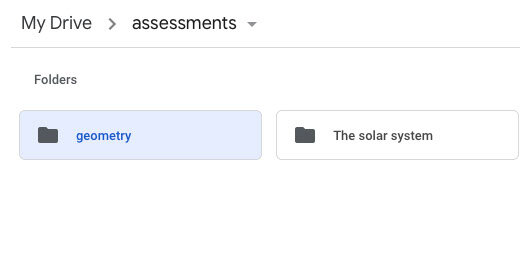
Within the geometry folder, I have a 2D shapes and a 3D shapes folder. Create a folder for your 2D shapes.

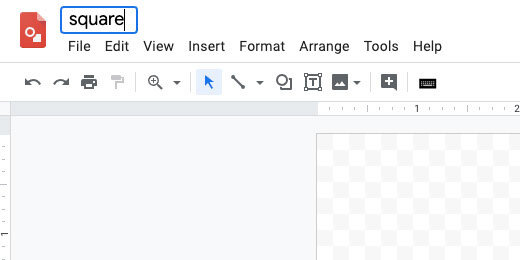
Create a new Google Drawing.
Set the name of the drawing to Square. We will begin with something simple.
Drawing setup
The default canvas has a size ratio set at four by three. I like to have a square-shaped canvas. This gives me a consistent framework for the shapes in the final product. Click File and select Page Setup.
Click the page setup selector and choose custom.
Set the width and height values to 10 inches. Apply the changes.
The square
Click the shapes selector button. Select the rectangle tool.
The rectangle creates a free form rectangular shape. The shape we want here is a square. We need to constrain the shape to a square. There is a keystroke that helps us. Press and hold the shift key while dragging out the shape.
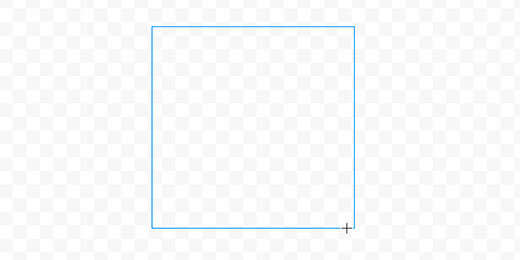
The shape does not need to fill the canvas. We will take care of that in the next step. Click the Format options button.
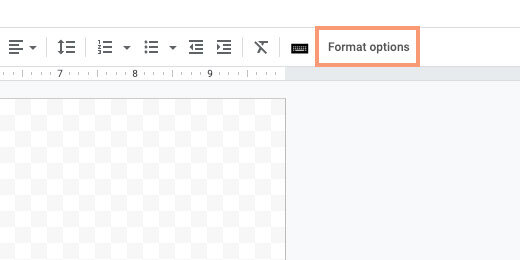
Open the Position option.
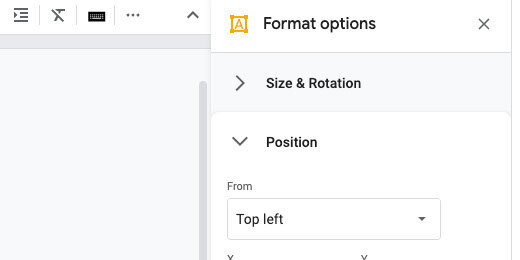
Set the x and y values to 1-inch.
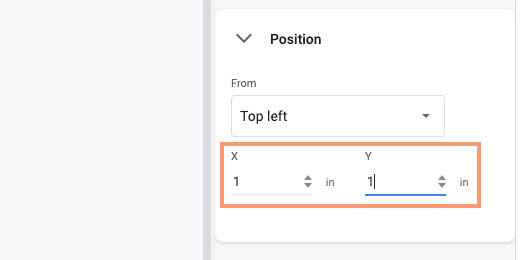
The values place the top left corner one inch away from both the top and left edges of the drawing canvas.
Open the Size & Rotation settings. Set the width and height to 8-inches.
The shape is centered on the canvas with a 1-inch space all the way around.
Click the shape fill tool. Select white.
Click the border width tool. Set the width to 4-pixels.
Click the text box tool.
Click once in the area between the box and the edge of the canvas.
Change the font size to 30 points. Type a capital letter A in the text box. Click the resize handle on the right and drag it toward the left. Stop before you get to the letter.
Click and drag one of the text box sides to position the letter near the corner of the square.
Click Edit and select Duplicate. Click and drag the duplicate letter to the right side of the square. Use the red alignment guide to keep the text boxes aligned. Double click in the text box. Change the letter from A to B.

Click once on once of the text box sides. Duplicate this text box. Move the text box to the bottom right of the box. Change the letter from B to C.
Duplicate this text box. Move the duplicate to the lower-left corner of the square. Change the letter from C to D.
Our square is done. The letters are used in the assignment to refer to the sides.
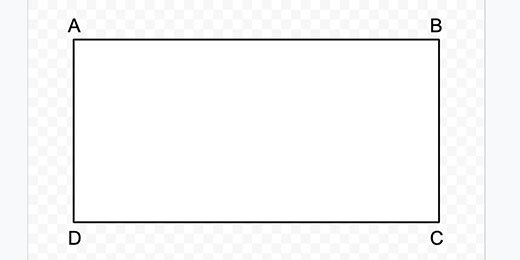
The rectangle
To save time we will use the square as a starter. Click File and select Make a copy.
Change the name to Rectangle. Click the Ok button. Click once on the shape. Open the Format options. Open the size & rotation option. Change the height to 4-inches. Open the position option. Change the Y value to 3-inches. Make sure the rectangle is centered vertically.
Move each of the text boxes close to each corner. Use the alignment guides to help position them.
That completes our rectangle.
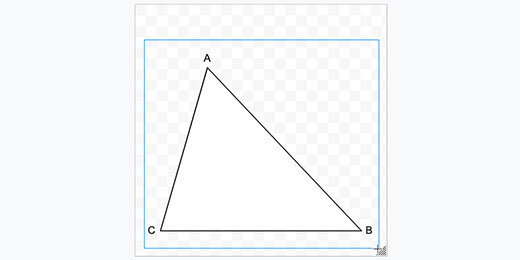
Right triangle
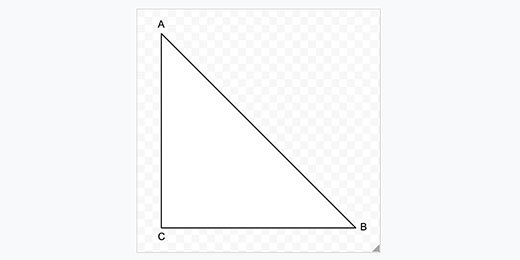
Return to Google Drive. Click File and select new Drawing. Change the page size to 10 inches by 10 inches. Name the new drawing Right Triangle. Click the shapes tool and select the right triangle tool.

Drag out a small right triangle on the canvas.
The options for the right triangle are almost identical to those for the square. Set the position for the triangle. Set X and Y to one inch. Set the width and height to 8-inches. Use the text box to create letters for each angle. Set the background color to white. Set the border thickness to 4 pixels.
Right triangles face in different directions. Let’s create those different right-triangle options. Make a copy of this drawing. Name the new drawing Right Triangle B. Select the triangle. Click Format options. Open size & rotation. Click the rotate by 90-degrees button once.
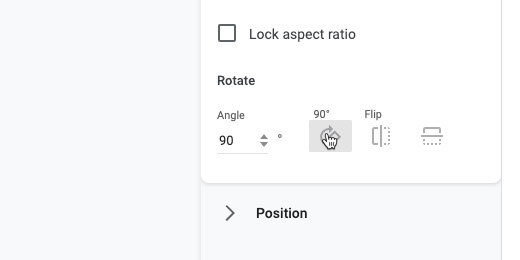
Reposition the letter B. We have our second right-triangle option.
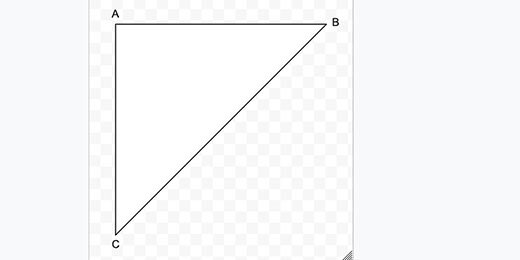
Create two more right-triangle options. Rotate each by the same 90-degrees. Name the right-triangles with the letters C and D.
Regular triangles
There are many other triangle forms. There are isosceles, equilateral, acute, obtuse, and scalene.
Create a new drawing. Set the page size to 10 by 10 inches. Name the drawing isosceles triangle. Click the shapes tool button. Select the triangle tool.
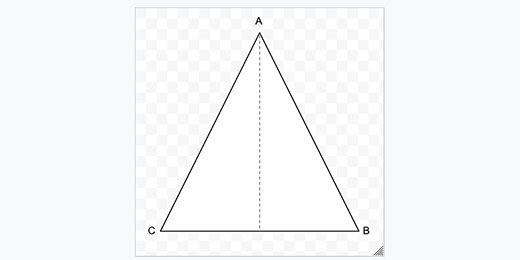
Draw a triangle shape on the canvas. This triangle shape is used to create a variety of triangles. Use the format options panel to set the hight larger than the width. This makes an isosceles triangle. Add text boxes with the letters A, B, and C for each angle.
In assignments, students need to solve for the area. To calculate the area, they need to know the height. We need a line to mark the height of the triangle.
Click the shapes selector and choose the line tool.
Click and drag a short line on the canvas. The line needs to be vertical. Hold the Shift key while drawing the line.
Click the line color tool and choose a dark grey. Set the line thickness to 3 pixels. Set the line style to dashed. Press the ESC key on your keyboard to release the line.
Drag the line toward the center of the triangle. A center alignment guide appears to help align the shapes. Release the line.
Drag the ends to stretch the line. The triangle has connection points. This helps connect the line to the center of the lines or the corners on the triangle.
Stretch the bottom of the line. Attach it to the line connector.

This completes the isosceles triangle.
Equilateral triangle
Make a copy of the isosceles triangle. Set the name of the drawing to Equilateral Triangle. Change the width and height. Use 8-inches for each. Reposition the text boxes as needed.
Scalene triangle
Make a copy of the equilateral triangle. Rename the file to Scalene Triangle. All the sides of a scalene triangle are different. There is an orange anchor at the top of the triangle. Click and drag the anchor to the left or right.
Shrink and stretch the bounding box until you have a triangle with different angles and sides. Move the letters to match the new angle positions.

After deforming the shape, it is no longer centered. It also doesn't fill the canvas. Drag a selection around the shape and the letters.
Drag the shape and letters selection toward the center of the canvas. Use the vertical and horizontal alignment guides.
Repeat this process to create different scalene triangles.
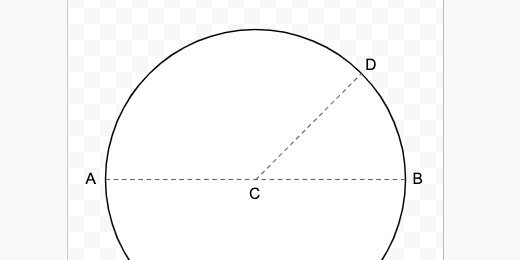
Circle
The circle will be our last shape. By now you should understand the process.
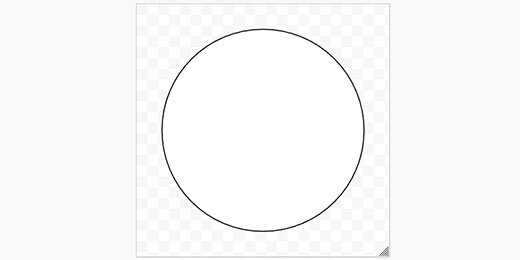
Create a new drawing. Set the canvas page settings. Choose the oval tool from the shapes selector.
Drag out a circle shape on the canvas. Use the Shift key to constrain the shape to a circle.

Use the format options panel to set the height and width of the circle. Set each to eight inches. Change the fill color. Choose white. Set the border thickness. Choose 4 pixels.
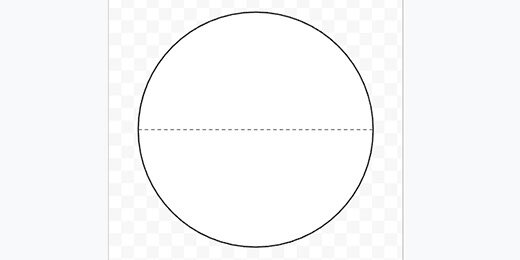
Get the line tool. Create a dashed line. Connect the dashed line to opposite ends of the circle. This marks the diameter of the circle.
Duplicate the diameter line. Connect one end to the center of the diameter line. Connect the other end to a separate point on the circle. This is the radius.
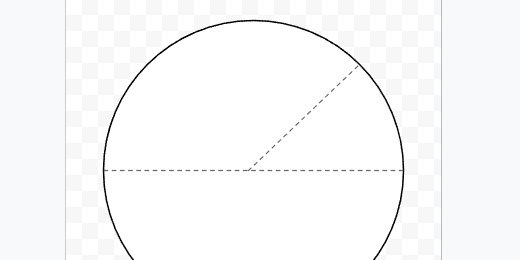
Create labels A, B, C and D. Place them where the lines touch each other or the circle’s circumference.
Assignments with shapes
There are plenty of shapes available in Google Drawings to create a wide variety of geometric shapes. Use the shapes and Google Docs to create assignments and assessments. Here is an example of an assignment.
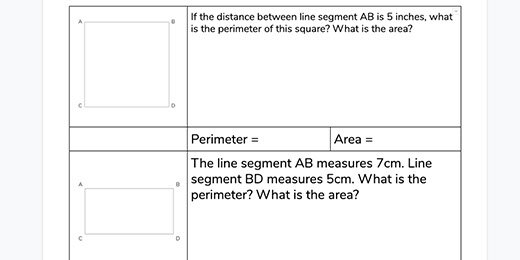
The students determine the perimeter or area of rectangles and squares. I used a table in Google Docs to organize the shapes and questions. Using letters for points on the shape allows me to identify them as line segments. This then allows me to provide measurement information. I have free samples on my Teacher Pay Teacher storefront.
Change the brightness of an LED with TINKERCAD and Arduino
In this lesson, we explore how Pulse Width Modulation works in a circuit connected to a microcontroller. I am using a virtual circuit constructed in Tinkercad. A microcontroller in Tinkercad, an Arduino, will vary the brightness of an LED. The brightness is adjusted with code entered into the microcontroller. The microcontroller uses Pulse Width Modulation to simulate various levels of illumination on an LED. We will see how pulse width modulation actually works by connecting a virtual oscilloscope to the circuit.

Introduction
In a previous article, I posted a lesson for using TinkerCad to construct a basic LED circuit. The LED in the circuit is turned on or off using an Arduino and a few lines of code. We used code to instruct Arduino when to turn the LED on or off. That’s as far as we got in that lesson. The link to the lesson is below.
https://digitalmaestro.org/articles/electric-circuits-and-arduino-with-tinkercad
In this lesson, I want to take the same instruction one more step. In the previous lesson, the LED was either on or off. We had no way of adjusting the brightness. We are going to address that option in this lesson. The link to the completed project is available below.
https://www.tinkercad.com/things/iOxi8dvvqMP
For this lesson, you need a TinkerCad account. The account is free. Go to tinkercad.com if you don’t have one.
New Circuit
Go over to tinkercad.com and log in. Click the circuits button. The button is in the menu on the left. Click the create new circuit button.

Click the random name assigned to the project. Change the name to variable led brightness.

Find the small breadboard in the components panel. Drag it onto the canvas.
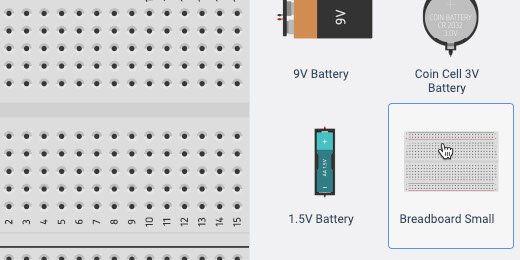
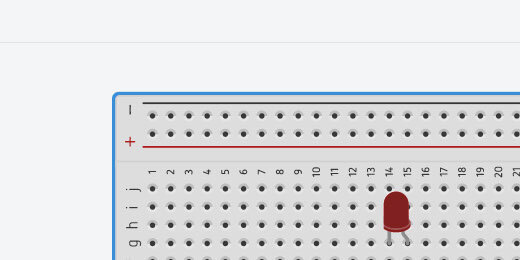
Find the LED component.

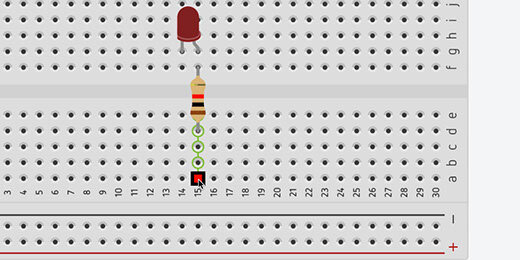
Place the LED on the breadboard. Place it somewhere in the middle. Leave space to attach wires above and below the connectors.

Find the resistor in the components panel.

Place the resistor across the upper and lower halves of the breadboard. Align the resistor with the Anode of the LED. The Anode is represented by the bent connector.

Click on a hole across from the resistor. This activates the wire tool and begins a wire connection.
Click a hole in the positive side of the terminal rails. Press the ESC key on your keyboard to release the wire tool.

Click the wire color selector and choose red.

This connects the resistor and LED to the positive terminal.

Connect a wire from the Cathode on the LED to a negative connection on the terminal. Set the wire color, choose black.

Click somewhere along the edge of the breadboard. This selects the breadboard. We need to reduce the size of the breadboard to make room for the Arduino.
TinkerCAD does not have many menu options. We need to use shortcut keys to manipulate some objects. Use the Alt and the minus(-) key on Windows and Chromebook. Mac users, use the Command and the minus(-) key. Use the Alt or Command key in combination with the plus(+) key to increase the size.

Click and drag the border of the breadboard toward the top of the canvas.
The Arduino is just below the breadboard in the components panel.

Place the Arduino below the breadboard on the canvas.
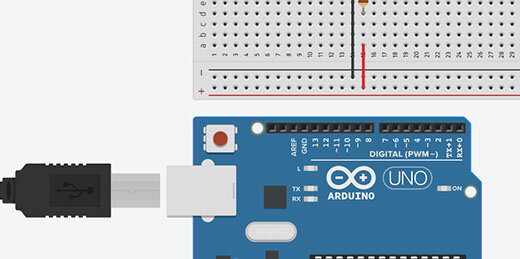
Connect a wire from the Arduino GND GPIO to the negative side of the terminal rail. GPIO stands for General Purpose Input/Output.

Arduino has several types of GPIO connections. The side of the board we are looking at as numbers from zero to thirteen. GPIO pins 0 and 1 are for transmitting text messages. Pins 2 to 13 are used for components.
Some of the numbers have a squiggly line. This is the Tilde character. Numbers without the tilde represent digital pins. We use these pins to turn the LED On or Off. Digital pins provide On or Off options only. These pins provide either zero volts or 5 volts.
Pins with the tilde character provide Pulse Width Modulation. These pins provide varying voltages.
Connect a wire from pin 6 to the positive terminal.

Coding Arduino
Click the code button to reveal the coding panel.
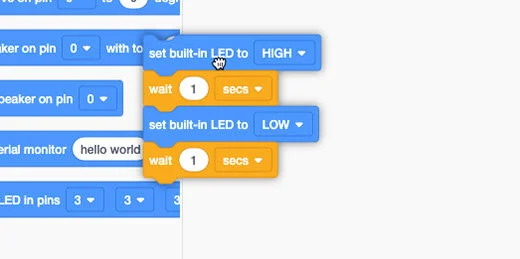
The panel has some code to get us started. This code is used for the built-in LED.

We don’t need this code. Drag the code blocks to the code section.
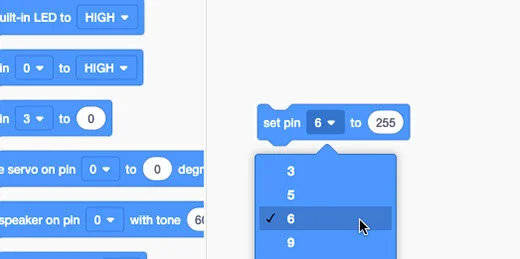
There are two set pin code blocks. One is used with the digital input pins. It has two parameters, high or low. The other set pin code block has a variable parameter. Drag this code block onto the coding area. This is the only code block we need.

Change the PIN number to 6. Change the variable to 255.
Click the Start Simulation button.

The LED should be on.

Click the Stop Simulation button.

Change the variable to 128. Start the simulation.

The available numbers for the variable range from 0 to 255. The total is 256. The value of 128 represents half of 256. The LED will light with half the illumination.
It is hard to tell but the LED is shining with half the brightness.

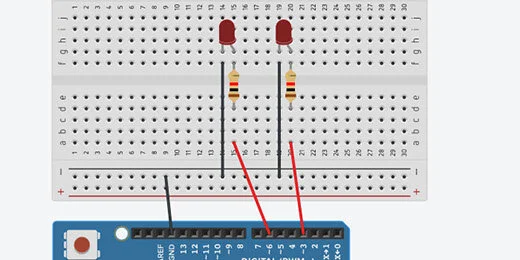
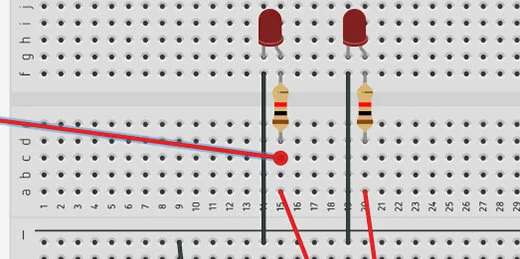
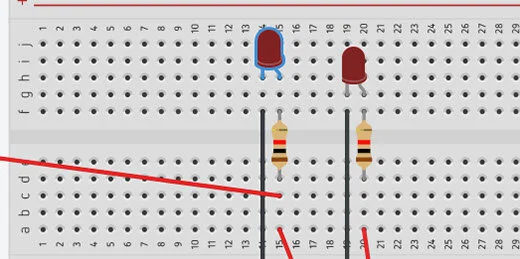
Let’s add another LED to help us with the comparison. Add another LED to the right of the current LED. Add a resistor and make all the same connections. There is one change we need to make. Don’t connect the resistor to the terminal rail.
Each LED needs to be controlled by a separate PIN. Connect the wire from the resistor directly to the GPIO pins on the Arduino. The original LED remains connected to PIN 6. Connect the other LED to PIN 3.
Open the code panel. Add another set pin code block. Place it after the existing code block. Set the pin to 3. Set the value to 255. Start the simulator.

That doesn’t help too much. There is a slight difference.

Stop the simulator. Change the variable for the first LED to 64. Start the simulator.

The difference is a little easier to see.

Pulse Width Modulation
What is pulse width modulation? It turns out that pulse width modulation is a sneaky way to simulate a lower voltage. This is easier to understand by using an oscilloscope. Oscilloscopes display the change in electronic signals over time. The oscilloscope will show us the voltage going through the circuit.
Click the Code button to close the code panel.

Click in the components search box. Type oscilloscope. Select the oscilloscope.

Place the oscilloscope on the left side of the breadboard. Adjust the size of the components so the oscilloscope is visible.

The oscilloscope has connectors. Click the connector on the right to create a wire.

Connect the wire to the resistor before it connects to the LED.
Move the LED up to make room for the next wire.
Connect the wire from the negative terminal of the oscilloscope to the cathode of the LED.

Click on the oscilloscope to select it.

Go to the oscilloscope configuration box. Change the measurement from ms(milliseconds) to (us)microseconds.

Change the time per division to 500. These parameters will display the frequencies from the voltage in 500-microsecond increments.

What is a microsecond? Think of a second. That is fast. A second is divisible into smaller time units. The next level of time is in milliseconds. There are one thousand milliseconds in one second. A microsecond is a millionth of a second. One million microseconds make one second. That is very fast.
Electricity travels very fast. Choosing microseconds slows things down so we can see the patterns on the oscilloscope.
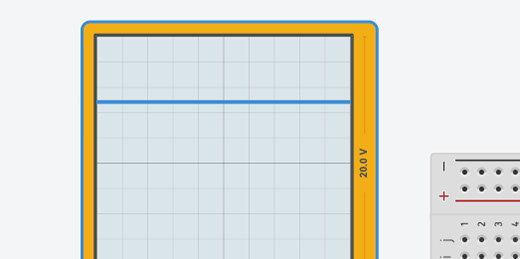
Open the code editor. Change the variable to 255.

Start the simulator and look at the oscilloscope. A blue line appears on the oscilloscope. This line represents 4.85 volts.
Stop the simulator. Change the variable to 0. Start the simulator. The blue line is in the middle. This represents no voltage going to the LED.

Stop the simulation. Change the parameter to 128. Start the simulator again. The simulator shows lines going up and down.

Let’s take a closer look. When a line appears at the top we know it represents 5-volts. A line at the center represents 0-volts.
This line isn’t flat. The line is at 4.85-volts for a time and then at 0-volts for another time.

The screen has a grid. The vertical lines represent 5ms. The gap between each line is 5ms long.

The oscilloscope shows that the voltage is zero for 5ms and then it is 4.85-volts for another 5ms. This pattern repeats.

Let’s think about what is going on. The voltage changes from 0 to 4.85 very quickly. This is like flipping a light switch on and off very fast. The LED is fully light for 5ms then off for 5ms. It is on half the time. The value we placed in the parameter is 128. This represents half the available voltage going to the LED.
Arduino is flipping the voltage on and off to simulate half the voltage going to the LED.
Stop the simulation. Change the parameter to 64. Start the simulation again. The bars in the simulation at the top are shorter than those at the bottom.

A short bar at the top represents a short time where the voltage is 4.85-volts. A longer bar at the bottom represents the voltage at 0-volts.
How long do you think the voltage is set to zero? The space between the vertical lines is 5ms. The line extends about halfway into the next space. This is roughly 7.5ms. The LED is off for 7.5ms and on for 2.5ms.
The parameter of 64 represents one-quarter of the total voltage. Think of it this way. A value of 128 is half of 256. A value of 64 is half of 128 and a quarter of 256. The LED is on for one-quarter of the time and off for the remainder, three-quarters.
The LED is on for less time and this causes the LED to look dim.
Our human eyes don’t see this pulsing. The pulses are so fast that our eyes take an average of what is going on. We don’t see a blinking LED but a dim LED. This is why we need an oscilloscope. To slow things down.
The voltage is pulsing through the LED. Probably where the name Pulse Width Modulation came from.
Multiple Choice with Google Docs
Matching assignments are useful as a formative or summative assessment. They assess student knowledge with support from possible answer choices. I use them when assessing basic concepts. They are particularly useful when assessing vocabulary and reading skills.

Introduction
Matching assignments are useful as a formative or summative assessment. They assess student knowledge with support from possible answer choices. I use them when assessing basic concepts. They are particularly useful when assessing vocabulary and reading skills.
In this lesson, you will learn to create a multiple choice quiz in Google Docs. We will use a table to organize the questions and choices.
I prefer to use Google Sheets to format the table. Sheets has a set of tools that makes this easier. Using Google Sheets to format the table frees me up to create the content without worrying about the formatting process.
Use the links below to access the resources in this lesson.
Get a copy of the final product: https://bit.ly/3hn9mmz
Get a preview of the final product: https://bit.ly/3f4BUiC
Copy of the working Document: https://bit.ly/2zvpPE8
Unicode bubble text: https://yaytext.com/bubble-text/
Preparation
We need to set up a few things. Create a new Google Document. Set the margins all the way around to a half-inch. Add another tab to your browser. Create a new Google Sheet.
I like letter choice options for students. They type the letter into a blank space next to the question or sentence. I like letters that are enclosed in a circle. They look more like the letters in a typical multiple-choice test.
Google doesn’t have a font for these letters, but there is a way to create them with the help of a web site. The link is in the introduction. You don’t have to go back to the introduction. Here is the link for you.
https://yaytext.com/bubble-text/
This website generates a letter inside a circle. Go to the web site and type the letter A in the input box. The letter font is generated in several styles. We are using the first style.

Click the copy button.

We are going to create several questions. Returning to this site for each letter gets tedious. I like to work as efficiently as possible. To this end, I use an automation option available in Google Docs.
Return to the Google Doc tab. Click Tools and select Preferences.

Click the substitutions section.

Click inside the first field on the right. Paste the character. This character replaces another character or characters we type.

Click in the field on the left. Type an open parenthesis followed by the letter a. Leave the substitute preferences open and return to the website tab.

Replace the letter A with B. Copy the character. Return to the Google Doc.

Paste the character into the box on the right. Type (b into the substitute field. Repeat this process for the letters c, d, and e. Add more letters if you need them.

I chose the open parenthesis followed by the letter because I am not likely to type this combination in the future. You can disable the replace option for these characters by removing the checkmark from the box.
These character substitutions are part of the global Google Docs preferences. They are available for all new and past documents.

Questions and choices
During the creation of each question, we are going to include special characters. These special characters will help format the table later. The character allows us to separate the text into table columns. We can use any character. I like to use a character that is not likely to appear in my question or answer choice.
I like to use the Pipe | character. It is rarely used so I like to use it for special applications. The Pipe character is on the key with the backslash (\) character. The pipe character also resembles columns.
The first question begins with a number followed by three Pipe characters. This represents three columns. The number is part of the first column. The question is part of the fourth column.

Press the Return key and begin providing the answer choices. The answer choices begin with three Pipe characters. Type a space followed by the substitution character for the letter A. An open parenthesis followed by a lower case A. Press the spacebar once after the letter to trigger the substitution.

Type the first answer choice. Press the spacebar. Type the Pipe character. Type the substitution characters for B.

Repeat the process for the remaining answer choices.

Press the Return key twice before beginning the next question. The sentence in the next example includes a period after the number. I did this for those that want to include a dot after the number. It does not affect the formatting.

In question three I added space after the number and before the question. This makes the document easier to read. Repeat the process for all the questions in the assessment.

Substitution tip
Sometimes I forget to type the Pipe character before the letter of the second choice. I updated the substation preference to include the pipe character when I use the letter b, c, and d. It saves me a step.

There is one more trick. Use one substitution for all the answer choices. I created a substitution with open parenthesis followed by the letter abcd. Make sure to include a space between each letter. Click once after each letter and type the answer choice.

Can you come up with other shortcut options?
Table conversion
Select all the questions and choices. Copy them.

Go to the tab with the Google Sheet. Paste the contents into the first cell.
The pasting process selects the rows with content. Make sure it remains selected.

Click Data and select Split text to columns.

We are prompted to select a separator. The separator is our Pipe character. Click the separator selector.

Our Pipe character is not one of the separator options. Select the custom option.

Type the Pipe character into the custom field. Sheets immediately recognizes the character and splits the text into columns.

Each question is split across several columns. We need to merge the columns for each question into one. Select all the columns that are part of the longest question. The longest question in my example is question 6. It extends to column H.

Click the Merge button.

Select the next question and click the merge button. Repeat the process for all the questions.

Select all the columns and rows with questions and answer choices. Click Edit and select copy.

Switch over to the Google document tab. Select everything and delete it. Press the Return key two or three times. Paste the Google Sheets content. You are prompted for a paste option. Select the option to paste unlinked.

The table needs some formatting.

Click Edit and choose Select All.

Select a font for the questions and answers. I like to use Nunito font. I also like Comfortaa font. They are easy to read. Select the 12 point font size. Click the Left Align button. Click once on the document to deselect everything.

Click and drag the right number column border inward. Move it close to the numbers but don’t crowd them.

Drag the answer space border to the right. Leave enough space for students to type the letter answer.

Drag the question border toward the left. This is the spacer. I use it to increase the space between the answer and the question.
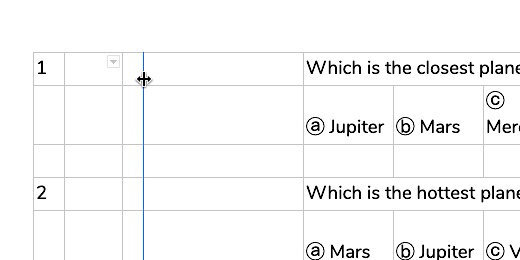
Drag the first answer choice border to the left. Make sure there is room for the longest answer.

Select the row with the first answer choices.

Right-click in the row. Choose Distribute columns.

Right-click somewhere on the table. Choose Table properties.

Choose black for the border color. Set the border size to zero points.

Make sure the cell vertical alignment selection is Bottom. Click the OK button.

It’s starting to look like a multiple choice quiz.

Click between the number 1 and the question. A border selector displays to the right of the cursor. Click the selector.

Choose the bottom border option.

Click the border thickness selector. Choose 1.5 points.
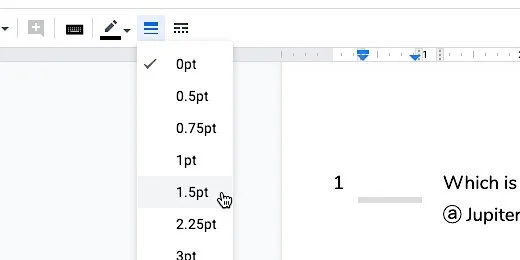
Repeat the process for the rest of the questions.
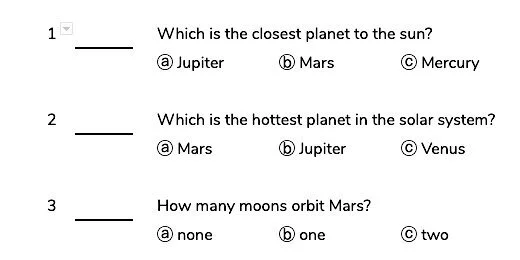
Add a title to the document and make it look nice.

This is your master document. Make a copy for students.

Update the name for the student copy.

Return to the original document. Update the name to identify it as your master document.

Set Master Version
Use this document with students in the class. Use it to review the answers. Set this document as your Master and your Answer key. Click File and go to the Version history option. Select Name current version. Type Original and click Save.
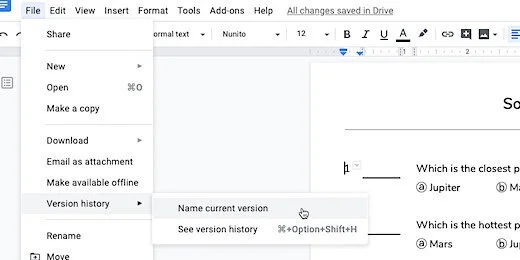
Answer key
Enter the correct answer for each question. Change the answer color to red.

Name this version of the document Answer Key.

Selecting a version
Click File and go down to version history. Select see version history.

Click the option to show only Named versions. Select the Original version.

Click the Restore this version button.

Repeat this process and choose the Answer Key version to see the answer key.
Word Search puzzles with Google Docs
Students love word search puzzles. I like them because they are a fun way to reinforce vocabulary skills. I used them for spelling, sentence completion, and definitions. I thought it would be great to demonstrate how to create some crossword puzzles using Google Sheets and Google Docs. The lesson includes a copy of the completed product. Once you create a couple you will find they aren’t that hard to create.

Introduction
Word searches are fun puzzle activities. They are also a good way to reinforce word recognition. I use word searches with students to help them with spelling and word definitions. They get a fun activity and an assignment.
There aren’t many tools for creating word searches on the Internet. The few tools that exist focus on creating printable word searches. They don’t lend themselves very well to online actives in the digital age.
For this lesson, you need to create a blank Google Document. You also need a blank Google Sheet. The Sheet is used to gather the vocabulary. It is also used to format the word search puzzle. The puzzle is copied to the Google Document for final preparation and distribution.
Use the links below to get a copy or see a preview of the final product.
Get a copy: https://bit.ly/37lAFZS
Get a preview: https://bit.ly/2MPzgBf
I am including a copy of the Google Sheet with the vocabulary used in this exercise. The link is available below.
Preparing the words
The Google Sheet has a list of vocabulary words. This word search reviews mammals covered in the lesson. In the sheet, I have the same list repeated three times. One column has the names with the first letter capitalized. The second has the letter in all upper case. The last has them all in lower case.
You can format the word search using all uppercase or all lowercase letters. The choice is yours. I want to show you how to format the words without having to retype them.
Google Sheets has plenty of useful formatting tools. I begin with Sheets when I have to deal with complex products.
Lowercase
Each word begins with a capital letter in the first column. I want all the letters to be lowercase.

Click on cell B2 and type =LOWER(A1). Press the Return key to apply the formula. This converts all the letters in the word to lower case.
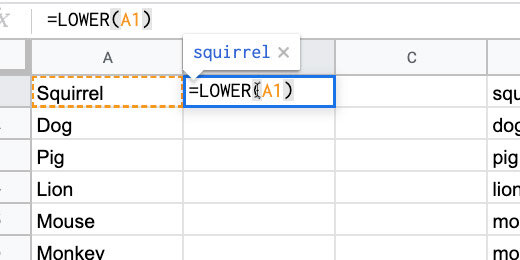
Select cell B1 again. Click the blue square in the lower right corner and drag it down.

This copies the formula down the column. Stop when you reach the end of the word list.

All the letters in each word are now lowercase.

The next column has words that are all lowercase.
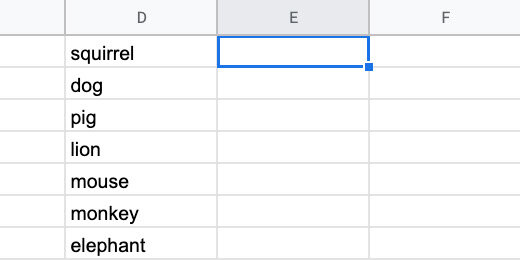
Click in cell E1 and type =UPPER(D1). Press the Return key.

Return to cell E1. Click the blue square and drag it down the column.
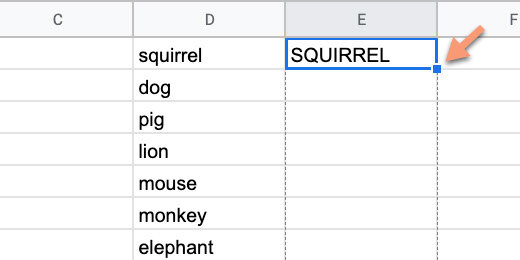
The letters in each word are transformed to uppercase.

Converting letters to upper or lower case it not all we can do. There is a function for converting the first letter in each word to upper case. It also changes the letters after the first to lowercase.
Click in cell H1 and type =PROPER(G1). Copy the function down the column.

Selecting a word list option
We have three options for the word search lettering. We only need one. The other options need to be removed. I am using the uppercase option.
This is how to remove the unwanted word list. Click on the column header with the word list to be removed.
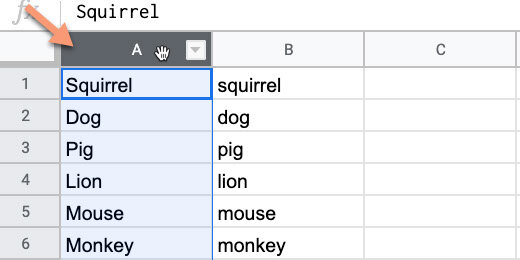
Click Edit and select Delete column. The column you are deleting is identified by the column letter.

The column that used the formula to convert the letters is filled with error messages. Click the column header and delete the column.

Keep deleting columns with the word lists you don’t want to use. Your list needs to be in the first or second column. You cannot have any content to the right of the column with your words.

Segment the letters
The letters for each word need to be in separate cells. Again, we are using Google Sheets to help with this process. Sheets has a split function. We are using this function in combination with Regular Expressions. Regular expressions are a type of code used to manipulate text. It is used very often by programmers.
Click in the cell to the right of the first word. Type or paste the formula below. Replace the B1 with A1 if your words are in column A.
=SPLIT(REGEXREPLACE("" & B1,"(\w)", "$1,"), ",")

The regular expression finds each letter in the word. It adds a comma after each letter. The Split formula uses the comma to split each letter and place it on a different column.

Click back on cell C1. Use the blue square to copy the formula down the column.

Organize the letters
We need to organize the letters across the column for use in the puzzle. Select the first row of letters. Those are the letters for SQUIRREL.

Click Data and select Named ranges.

A panel opens on the right side.

Change the name of the range to squirrel. Click the Done button.
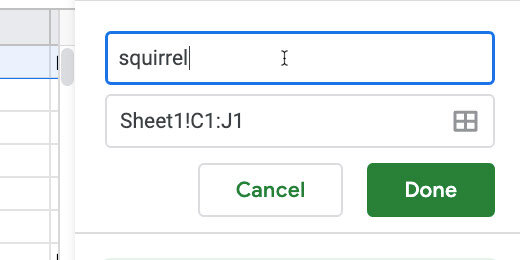
Highlight the letters for DOG in the next row.
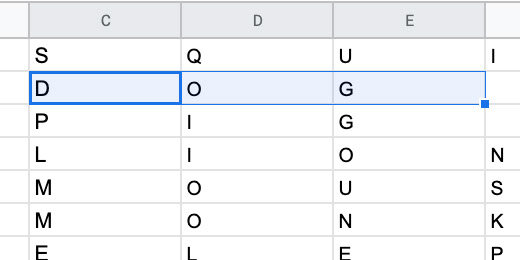
The Range panel is still visible. Click Add a range.

Name the range dog and click the Done button. Repeat this process with all the words.
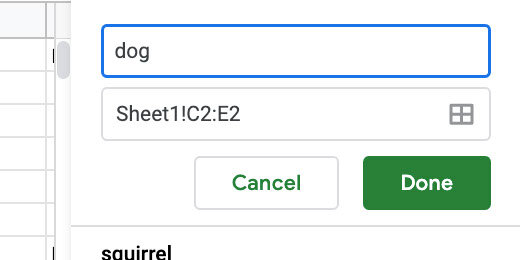
The list of named ranges is organized alphabetically.

Close the Named ranges panel.

Create a new sheet
Find the Plus button at the bottom of the spreadsheet. It is next to the first sheet name.

The sheet is added to the right of the first. Double click the sheet name.

Replace the name with mammals.
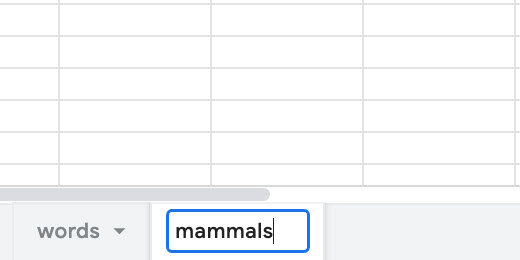
Click the square above the number 1 and to the left of the letter A. This selects all the columns and rows.

Click Format and go down to the Align option. Select Center align.
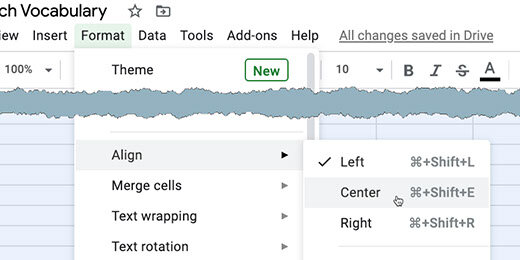
Click Format again. Go to the Align option and select Middle.

Column Size
Click on column A header. We need to select all the columns. Here is a shortcut key combination to help. Chromebook and Windows use the keyboard combination Shift+Alt+Right Arrow. Mac uses the keyboard combination Shift+Command+Right Arrow.
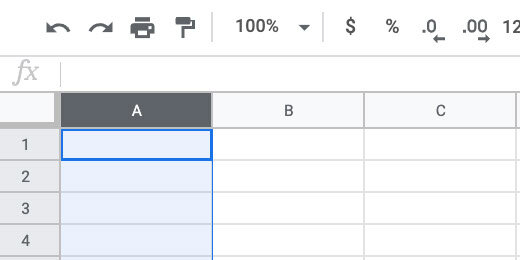
Right-click on one of the column headers. Select the Resize columns option.

Change the column size from 100 to 35. Click the OK button.

Click the row 1 header. Select all the rows. Here is a shortcut keyboard combination to help. Chromebook and Windows press the Shift+Alt+Down-Arrow. Mac users press Shift+Command+Down-Arrow.

Right-click one of the row headers. Select Resize rows.
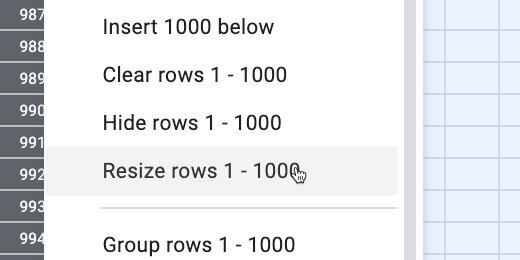
Set the row height to 35 pixels. Click the OK button.
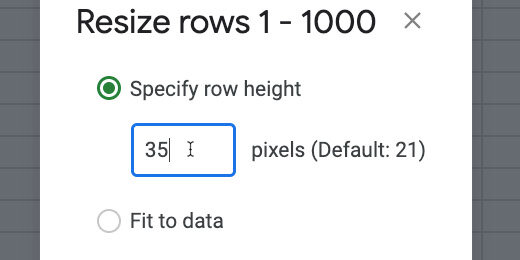
Scroll back to the top of the sheet. Skip one or two columns and rows from the edge of the sheet. This is where we will place our first word.

Words across
The first word will go across the page. Think of one of the words you would like to use.
Sheets has a function to bring in an array of information from cells. The function is called ARRAYFORMULA. Type =ARRAYFORMULA followed by an open parenthesis. Type the first two letters of the word you want to use. My word is kangaroo.
The function provides help by guessing what we want. The function found our list of named ranges. The green icon next to the word kangaroo indicates a named range.

Finish typing the word and type a closing parenthesis. Press the Return key.

The word kangaroo appears across the row.
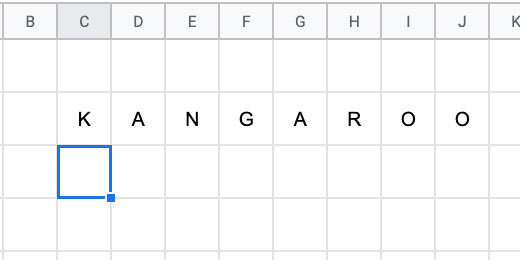
Words down
To place words going down the column we use a different function. Click on one of the cells below the word kangaroo. Type =TRANSPOSE(elephant) and press the Return key. Choose any word you prefer.

Here are the first two words. Repeat the process to place words across or down. Try to keep your words within a frame. The frame I use is usually 15 columns by 15 rows.
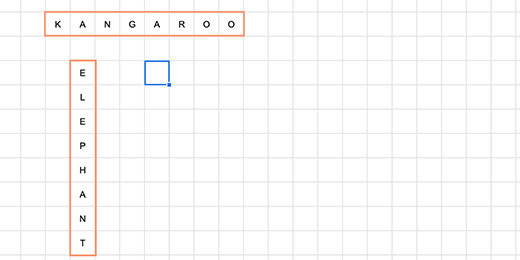
I provided 27 words but we don’t have to use them all. This is just the first part of an exercise. This word search includes 10 random words I chose.

The next step involves adding lots of letters in the empty squares. To keep things easy, I like to color the words. Highlight the cells of each word. Change the font color. I like to use red.
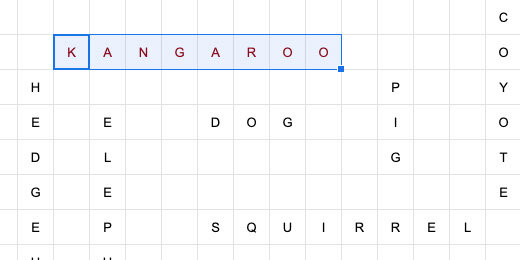
Random letter array
We need to create a random letter array. Create a new sheet. Change the sheet name to random letters.
Type each letter of the alphabet down the first column. Make sure the letter case matches the case used by the words.

Select the letters in the column. Click Data and select Named ranges.

Set the range name to alphabet.

Go back to the mammals sheet. Click on the first empty cell.
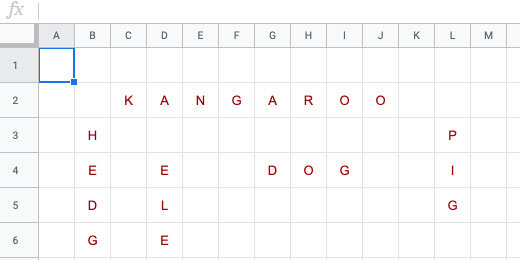
Type the function below. Copy and paste it from the text to make sure there are no mistakes.
=index(alphabet,randbetween(1,counta(alphabet)))
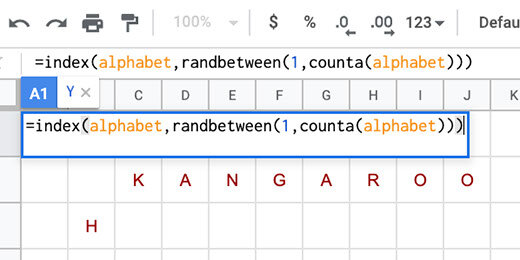
The Index function provides a number to each letter. The randbetween function selects a random letter within the selected range. The index function uses the named range to index the letters. The randbetween function uses the named range to select the random letter.
Click and drag the blue square to fill in the empty squares. I have empty squares to the right.

Stop before you reach one of the words.

Select one of the squares with a random letter. Copy the function to empty nearby cells.

Use any random letter square to fill in an empty square.

Repeat the process until you have filled in the empty cells in the grid.

Finish with Google Docs
Select all the cells in the word search. Click Edit and select copy.

Go to an open blank Google Document or create a new document. Press the Return key three times to add some space for a heading. Paste the word search.
Select paste unlinked when prompted for a paste option.

We are almost done.

Right-click anywhere on the table and select Table Properties.

Go to the table alignment option and select center. Click the OK button.

Add a title and some instructions.

This puzzle provides a list of words that are in the word search. The words are below the grid.

A list of words might be too easy. Here is another option. Provide a list of definitions.

Sentence completion is another option.

How it works
The document we created is our master. It is also the answer key. Make a copy of the document for students.

Update the name to identify is as the student copy.

Select all the cells in the student copy. Change the font color. Black is good.
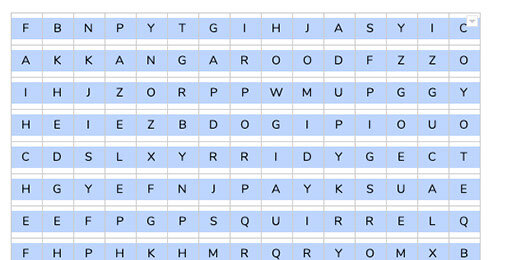
Student fill-in
Students select the letters across the cells.

They use the cell background color to highlight the word.

This is what the student assignment looks like.

Master and answer key
Return to the original word search document. This is your master and your answer key. Use this document to introduce or review the assignment. You need to set restore points before using this in your classroom.
Click File and go to the Version history option. Select Name current version.

Name the version Answer key. Click the save button.

Select all the contents of the table. Change the font color to black.

Click File again. Go to version history and select Name current version. Name the version Original and click save.
The answer key
Use version history to see the answer key. Click File and go to version history. Select the option to see the version history.

The document version history is in a panel on the right. Toggle the option to show only named versions.
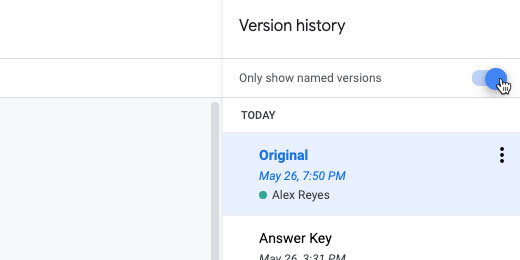
Click the answer key version.
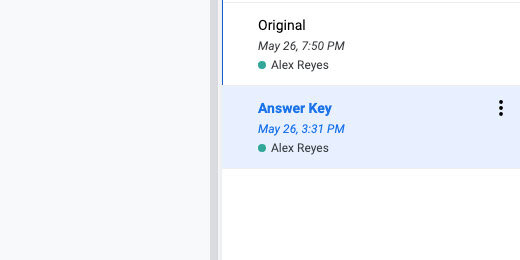
Click the restore version button. Click the confirm button when it appears.
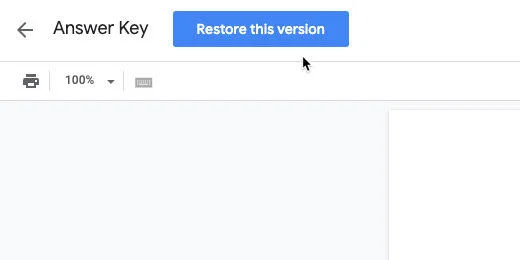
Matching and multiple choice with fill-in the blank using Google Docs
In this lesson, we create a multiple-choice assignment with google docs. This is a wonderful way to add interactivity to assignments. Create the assignment and use it as a template for future assignments. Use it for review and assessments. There are some extra tips I use with this assignment.

Multiple choice and matching assignments are a good way to review concepts. We are creating a document in Google Docs that is good for multiple choice or matching. It is also good for True/False review questions. Create a new Google Document. Type the sentences or questions. The document in this lesson is available to download if you would like to follow along. Use the link below.
Use the links belwo to get a copy or preview of the final product.
Get a copy: https://bit.ly/2BWc0zl
Get a preview: https://bit.ly/2Yqsze2
This assignment is a review of the inner planets in the solar system. Students will match the vocabulary word with the sentence.

We are using a table to organize the sentences. The table provides a nice way to create underlines. Google Sheets provides a fast way to arrange the sentences into a table. Open another tab and go to the Google Sheets application. Create a blank spreadsheet. Let’s use Google Sheets to do some work for us. Type the numbers 1,2, and 3 in each cell down the first column.

Select the numbers.

I have fifteen questions in my assignment. So, I need fifteen numbers. Click and drag the little square at the bottom of the selection. Stop when the selection is at row fifteen.

This is a quick way to create a list of numbers.
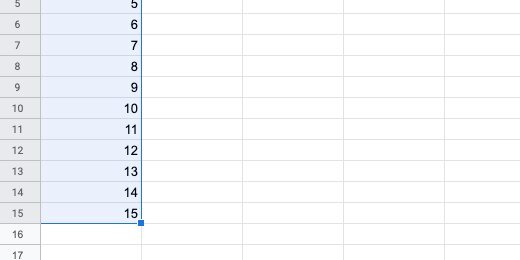
Go back to the tab with the questions. Select all the questions and copy them. Return to the spreadsheet.

We need columns between the numbers and the sentences. One column is for the vocabulary space. We need a column on either side of the column to provide padding. We need three columns between the numbers and the questions or sentences. Click on cell E1 and paste.

Each sentence is placed in a separate row.

Select the cells from A1 to E15. Copy the cells. Return to the document.

Press the Return key a couple of times after the last sentence. Paste the contents of the spreadsheet.

Paste prompts for a paste option. Choose not to link the data.

We don’t need the original sentences. Select and delete them from the document.
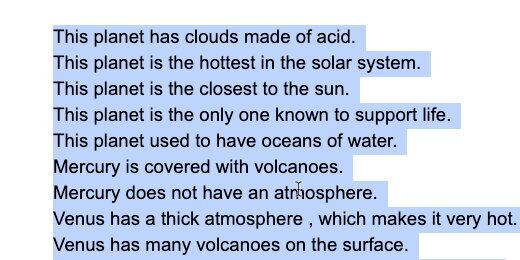
Remove any extra lines above the table. Leave one line for the assignment information and instructions.

Drag the border on the right side of the numbers column inward.

Make sure to leave room for the numbers with double digits.

Move the next column border inward until it can't go any farther.

The next column is for the answer. Bring it inward. Leave some space for the answer. We will fine-tune this spacing later.

Move the next column inward. Move it in as far as it will go.

Move the right outside border to the right. Match the border with the page margin marker.

Select all the cells in the table.

Set the font to Ariel. Set the size to 12 points.
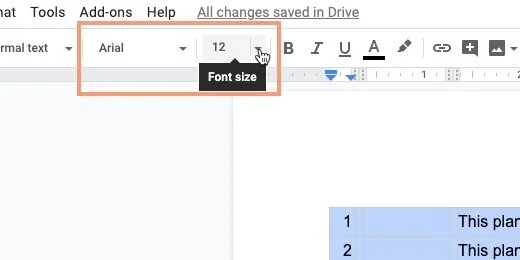
Click once on a cell in the table. Right-click to get the contextual menu. Select Table Properties.

Set the table border size to zero points.

Set the border color from the color picker. Choose black. Click the OK button. This color is for later.

Click in the cell for the first answer space. Click somewhere in the middle. Click the border selector.

Select the bottom border option.

Go to the button bar. Select the border thickness selector. Choose one point.

This line identifies the place for students to type their answers.
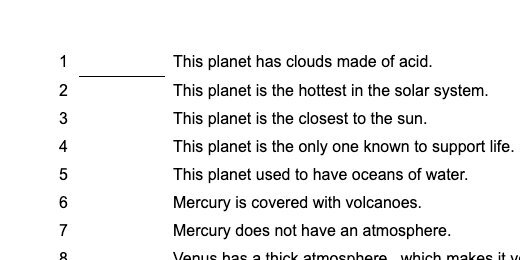
Repeat the process for the remaining cells.

The spacing between the blanks and sentences is too close for me. This is how to adjust the spacing. Click once in the cell with the first sentence. Click the border selector option. The option appears on the far right. Choose the left border.

Choose a thick border option. It’s easier to select the border when it’s thick.

Nudge the border to the right.

Don't deselect the border yet. Change the border width back to zero points.

The blank spaces we created are an approximation. Fill out the spaces with the answers. One of the answers doesn’t fit in the space.

Widen the answer space. Choose the right border option.
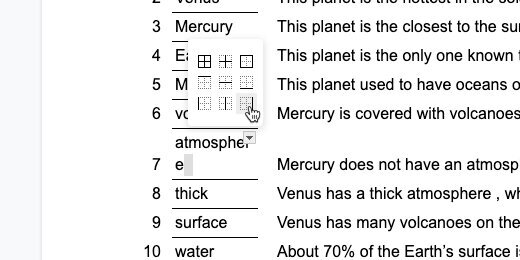
Adjust the spacing.

This document is our answer key. Don’t erase the answers yet. Some answers are included in the sentences. We are replacing them with underlines. Go to the 6th line. Erase volcanoes.

Click the text underscore button.

Press the space bar a few tiles to create the underline.

Repeat the process with the remaining sentences.

We are almost done. I would like to cover one more option. We usually need to provide the same document to students with special needs. This requires differentiation or modifications. I include a list of the terms for these students. Click once in the space below the table. Press the Return key three times.

Click Insert and go to the table option. Create a table with four columns and four rows.

Enter each of the terms into a separate cell.

I like taking one more step. Highlight the column with the answers.

Change the font to Comic Sans. Change the color to anything you like.
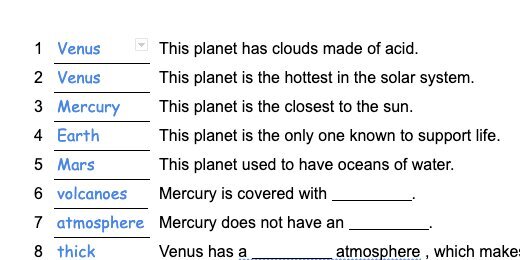
Click once above the table. Press the Return key twice. Provide a title for the assignment. Make it look nice.

Make a copy of the assignment.

Update the name for the copy. This is the one going to students.

Highlight the answer column on the student copy. Press the Delete key to erase the contents.

Distribute this document using Google Classroom.
Teacher Master Document
You are eventually going to use this document with students. Use the document for a whole group activity. Use it to check the assignment answers with the class. Use it for teaching and review. Return to the tab with the original version. This is what I do with my documents when using them with students. I use Google’s Version history. Make sure none of the answers are on the document. Click File and go down to version history. Select the option to name the current version.

Name the version Original and click Save.

Fill in some of the answers.

Click File and go to version history. Select see Version history.

Click the Original history marker.

Click Restore this version. The blanks are empty again.

Answer key version
It’s nice to have a version for the answer key. Fill in the blanks with the answers. Create a version and name it Answer Key. Go back to version history and retrieve the original version. Retrieve the answer key by selecting it from version history.
Bonus
Enable the option to show only named versions.

Fill in the blank document with Google Docs No table required
This lesson creates a fill in the blank exercise without using tables. We use the equation editor to make the process easier. Create the assignment and distribute it to students using Google Classroom. Use the same document for review and assessment.

Fill in the blank – no tables required
I a previous lesson I showed how to create a fill in the blank sentences document. I used a table to format the paragraph. This is a great method, but it does take time to create. I have a faster method for you. The first step is to create sentences or paragraphs. Use the link below to get a copy if you want to follow along.
Use the links belwo to get a copy or preview of the final product.
Get a copy: https://bit.ly/2MJUalj
Get a preview: https://bit.ly/3dSAQhE

sample paragraph
Highlight the words you want to assess. Select a word and use the background color selector. Choose a light color so the text is still easy to read.

choose a light color to highlight words
The paragraph looks something like the image below.

highlight words to be assessed
Highlight the paragraph and make a copy.

select the paragraph and make a copy
Insert a few carriage returns between the paragraphs. Paste the copy below.

paste below the previous paragraph
Erase the first word.

erase one of the words
Click Insert and select Equation.

insert an equation
Type a backslash followed by the word underline.
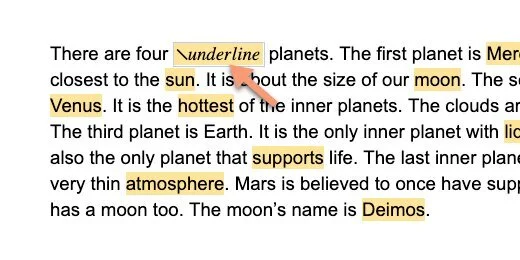
backslash and underline
Press the spacebar five times. This creates the underline. The underline doesn't have to be very wide. The underline command does not show as part of the paragraph.

fillable space created
Repeat the process with the next word. The missing words in my example are highlighted. I like this option. It helps students identify where words need to be inserted.
To keep the highlight, follow this step. Highlight the word and don't erase it. Insert the equation command while the word is selected.

spaces with and without highlighting
Students type the words on the underline. The space increases to accommodate the word.

words placed in the paragraph
Make a copy of the document.
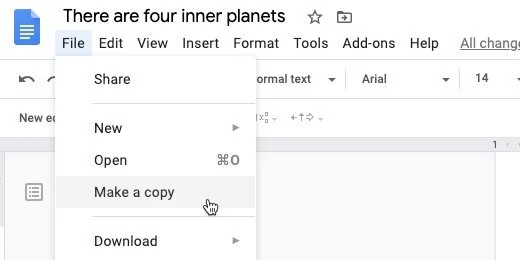
make a copy
Make sure to update the name.

rename the copy
Add a heading and make it look nice. Distribute to students using Google Classroom.

format the student copy
Teacher Master Document
You are eventually going to use this document with students. Use the document for a whole group activity. Use it to check the assignment answers with the class. Use it for teaching and review. Erasing the answers is easy but tedious. This is what I do with my documents when using them with students. Return to the tab with the original version. Click File and go to version history. Select the option to name the current version.

name a version for the master
Name the version Original and click Save.

name the master original
Go ahead and fill out part of the document.
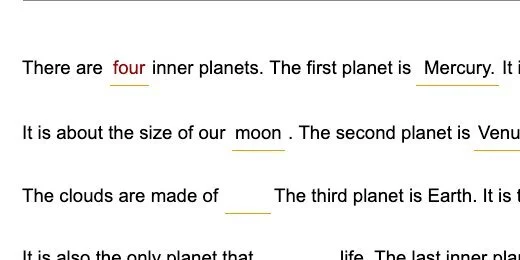
fill in some of the words
Click File and go to version history. Select See version history.

see version history
Selection the Version marked as Original.

select the original version
Click Restore this version. The document with the empty blanks is restored.
restore the original version
Answer key version
It’s nice to have a version for the answer key. Fill in the blanks with the answers. Create a version and name it Answer Key. Go back to version history and retrieve the original version. Retrieve the answer key by selecting it from version history.
Bonus
Enable the option to show only named versions.

show only named versions
Matching with Google Drawings
In this instruction, you will learn to create a matching exercise using Google Drawings. Match by connecting lines to vocabulary, ideas, and concepts. Create the assignment and reuse it for different assignments. Distribute the assignment using Google Classroom. Use the assignment for review and assessment.

Fun matching assingments for students
Remember those matching exercises where you drew a line from one item to another? That is what this lesson is about. We are creating a matching exercise for students to match a list of items with another.
Use the links below to get a copy or preview of the final product.
Get a copy: https://bit.ly/2AZ1W7Y
Get a preview: https://bit.ly/2AXuqPL
This lesson begins with Google Sheets to organize our items. We then use Google Drawings to create the exercise itself. I have the link to the exercise in Google Sheets if you would like to follow along. The link is below.
Get a copy of the exercise to follow along.
Use the sheet from the link above or create a new blank Google Sheet. Title the Sheet Matching Activities lists. The list in the example has 10 words. Columns one and two contain the prefix and root word.
Using Google Sheets to organize the content is much easier than trying to do it in Drawings. There is another benefit of using Sheets.

We need to mix the prefixes and root words for the exercise. Select the prefixes.

Click Data and select Sort Range.

Click the Sort button.

Select the root words. Click Data and select Sort Range. Click the Sort button.

We have a nice mix for the exercise.

Open a new tab. Go to your Google Drive and create a Google Drawing. Title the Drawing Prefix Review Assignment. Return to the spreadsheet. Select the prefixes in column A. Copy and paste them into the drawing. Select the option to paste unlinked. Click the paste button.

Move the mouse arrow to the top of the table. Move the arrow to one side of the three dots. Look for the arrow to change to four arrows. Click and drag the table to the right.

Return to the spreadsheet. Copy the root words in column B. Paste them into the drawing. Remember to unlink the pasted contents.

Move the table with the root words to the right.

Click on the table with the prefixes. Make sure the outline of the table is visible.

I am going to be precise about the placement of my tables and content. This is to help you set up a document like mine. Click the Format options button.

Open the Position section.

Set the X and Y positions to 1.5 inches.

Open the size and rotation section. Set the width to 1.5 inches. Set the height to 5 inches.

Select the table with the root words.

Open the Position section. Set the X position to 6.5 inches. Set the Y position to 1.5 inches.

Open the size & rotation section. Set the width to 1.5 inches. Set the height to 5 inches.

Return to the table with prefixes. Select the cells in the table.

Set the font to Ariel. Change the font size to 24. Set the text to Right Justification.

Select the root words. Set the font to Ariel. Change the font size to 24.

Click the shape selector. Choose the oval tool.

Create a small circle on the canvas.

Change the width and height to .35 inches.

Click the border color tool. Select the transparent option.
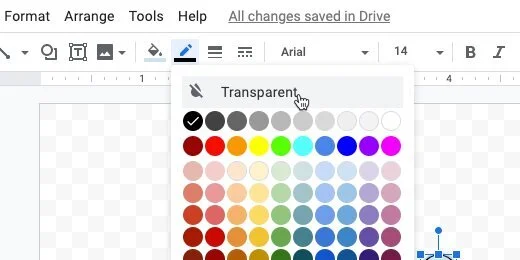
Move the circle next to the first prefix. Use the smart guide to align the circle to the bottom cell border.

Click the line selector tool. Choose the arrow.

Move your mouse arrow to the circle. The arrow changes to a plus symbol. Move the symbol over the circle. Dots appear around the circle. These are anchor points.

Click the anchor point on the right side. Drag an arrow to the right.

Press the Esc key to release the tool.

Click the line thickness selector. Choose a thickness of 3 pixels.
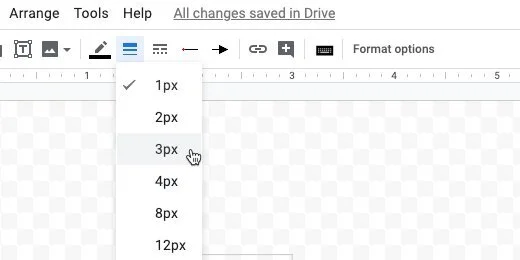
Click on the canvas to deselect the arrow.

Click and drag a selection around both shapes.

Click Edit and select Duplicate.

Move the duplicate shape down. Use the alignment guides to align the objects.

Keep the shape selected. Use the shortcut keys Control+D on windows or Chromebook to duplicate the shape. Use Command+D on Mac. Move the duplicate shape below the previous shape. Use the distance guides to help space the shapes evenly. Repeat this process for the remainder.

Draw a selection around all the shapes. Click Edit and select duplicate.

Move the duplicate to the right of the original. Deselect the duplicate.

Draw a selection so only the arrows are selected. Press the delete key to remove the arrows.

Draw a selection around the circles. Move the selection to the right. Move them close to the root words. Use the alignment guide above. This keeps the circles aligned with the ones on the left.

Keep the circles selected. Click the border color tool. Choose a color.

Select the fill tool and choose white.

Choose the circle for the first prefix.

Click the fill color. Choose light red berry 2.

Select the arrow.

Click the arrow color tool. Choose light red berry 2.

Go to each of the circles and arrows and choose a different color. Make sure the colors contrast.

Right-click on an empty area of the canvas. Go to the background option. Choose a neutral grey.

Select all the cells in the prefix table.

Click format and go to the Borders & lines option. Choose the Transparent option.

Repeat the process with the root words table.

Don't do this next step yet. I need to show you how to go through and reset the assignment in a moment. This is how it works. Students click on an arrow.

They click and drag the arrow point to the corresponding root word. The arrow attaches itself to one of the anchor points.

They select the next arrow and repeat the process.

The different colors identify the connections.

Add a title to the top of the assignment. Click Insert and select the Text box.

Draw a rectangular text box.

Provide a title.

Make a copy for students.

Put the word student somewhere in the new name.

Go back to the tab with the original document. This is your copy. You will use this for demonstration, in-class participation, or review. This is what I do with my documents when teaching.
Teacher master document
I use Google's Version history. Click File and go down to Version history. Select the Name Current version option.

Name the version Original and click Save.

Use the arrows to make the matching connections.

Click File and go down to version history. Select see Version history.

Find the version name Original and select it.

Click the Restore this version button.

Answer key
It’s nice to have a version for the answer key. Connect the correct answers. Create a version and name it Answer Key. Go back to version history and retrieve the original version. Retrieve the answer key by selecting it from version history.
Bonus
Turn on the option to show only named versions.

Fill in the blank with Google Docs
Fill in the blank exercises are useful for younger students. They are helpful when learning new vocabulary. I like using fill in the blank, or Cloze sentences with students. In this lesson, we are using Google Docs and Google Sheets. Google Sheets is useful when creating the table to separate the vocabulary.

Use tables to format the sentences
Fill in the blank exercises are useful for younger students. They are helpful when learning new vocabulary. I like using fill in the blank, or Cloze sentences with students. They reinforce vocabulary skills using context. Students use the surrounding words to infer which word needs to be in the sentence. They apply vocabulary in context. It provides a valid assessment of their comprehension.
Use the links below to get a copy or preview the final product.
Get a copy: https://bit.ly/2zpLai8
See a preview: https://bit.ly/2zmzSv3
In this lesson, we are using Google Docs and Google Sheets. Google Sheets is useful when creating the table to separate the vocabulary. I use the sheet as a tool during the creation process. I keep one around like scratch paper.
Create a Google document for the paragraph. Create a blank spreadsheet to format the table. Have both tabs open in your Chrome browser.
Begin with the paragraph. This is the template and answer key. This paragraph reviews concepts and vocabulary for a lesson on the inner planets. Use the link below to get a copy and follow along.
Get the example paragraph copy
This works better when the document is in landscape orientation. Click File and select Page Setup.
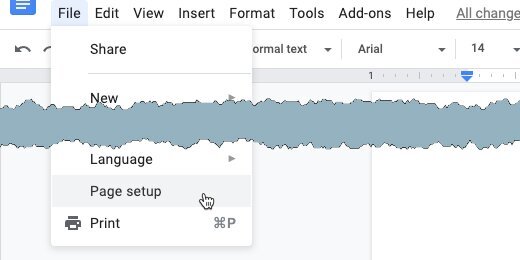
page setup
Select Landscape and the OK button.

set page to landscape mode
The paragraph has several terms related to the inner planets. I Select and highlight each word to be assessed.

sample paragraph
Double-click on a word. Use the background color picker. Use a light yellow color.

highlight color
This what my paragraph looks like. Highlight the words in my image.

select words highlighted
Insert a hard return before the next sentence that wraps around. Make sure each line ends in a complete sentence. This makes things easier.

end lines with hard returns
To separate the vocabulary in Sheets, we need markers to identify the separations. The marker can be any symbol. It can’t be a letter. I like to use the asterisk. Place an asterisk before and after each highlighted word. Place the asterisk after a period if the word comes before a period.
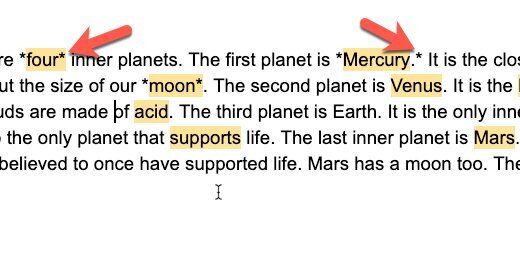
asterisks to separate words
Select the first line of sentences and copy them.

copy the first line
Go to the blank spreadsheet. Paste the sentences into the first cell.
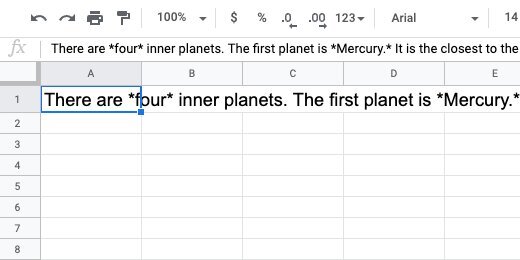
paste the line into the first cell
Go back to the document and copy the next line of sentences. Paste it into the next row in the Sheet. Copy each sentence and paste it into a separate row.

paste each line into a separate row
Select all the rows in the first column that have sentences.

select rows with sentences
Click Data and select Split text to columns.

select split text to columns
Sheets uses a separator to identify where to split the text. This is the asterisk we used.

select separator
Click the separator selector. The asterisk is not part of the standard separators. Select the Custom option.

choose custom seperator
Type the asterisk into the custom field. The words are instantly separated.
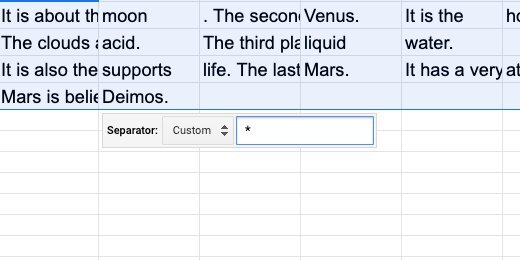
set the separator to the asterisk
Find the last column with sentence information. Select everything in the first row up to that column. Copy the contents.

select the first row with content
Return to the document. Press the Return key after the paragraph a few times. Paste the sentences. Google wants to know if it should keep the link with the spreadsheet. Select the option to paste unlinked. Click the Paste button.
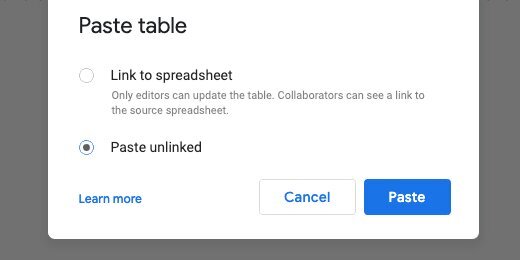
paste the row into the document and unlink from the sheet
We need to resize the columns.

the sentence separated into separate columns
Click and drag each column separator so the sentence looks uniform.

adjust the column width and height
Copy the next sentence from the sheet. Paste it below the first sentence table. Each line of the sentence is pasted into a separate table with one row.

cursor below table
It’s easier to use separate tables.
paste next sentence
Repeat the process with the remaining sentences.

paste all sentences and adjust
We need to remove the table borders. Click inside on one of the cells in the first table. Go to Format in the menu. Move down to the table option. Select Table properties.

table properties
Click the table border size. Choose zero points. Click the OK button.

set border to 0pt
Repeat the process for the other tables.

all tables with no border
Click on the first word to be filled in.
select word to erase
The border selector appears above the word. Click the selector. Choose the bottom border.

select bottom border option
Click the border color selector. Choose a color. I like the orange color.

select border color
Click the line size selector. Choose 1 point.
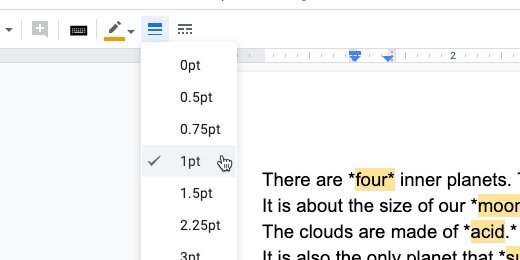
set border to 1pt
Erase the word. Repeat the process with the other words.
erase word
It gets tedious selecting the border color and width. Here is a timesaver. Copy the contents of a formatted cell. Make sure it doesn't have a period.
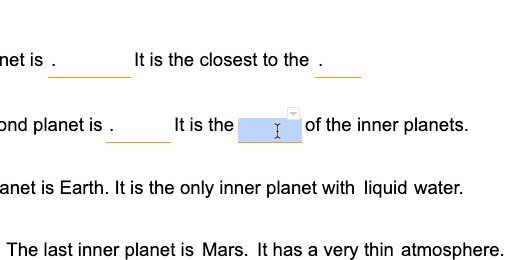
repeat with other words
Highlight the next word and paste. This erases the word and formats the cell.
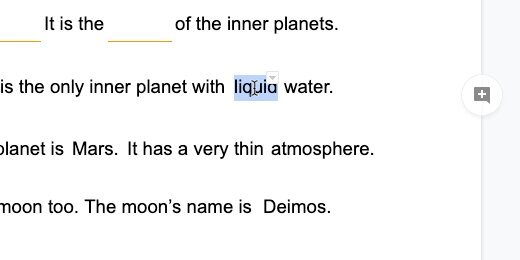
paste format to save time
Everything is looking nice. I have some periods in odd places.
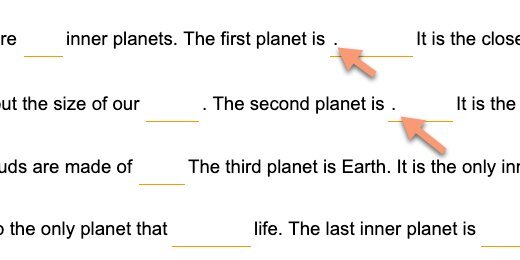
dealing with periods
Click in the cell with the period that is in an odd place. Click the Right align button.

align text to the right
All is right with the world.

repeat with all sentences that need it
Keep this document as your answer key. Make a copy.

make a copy of the document
Update the name for the copy.

rename the copy
Remove the original paragraph. Add a heading and make it look nice. Distribute to students with Google Classroom.

format the student copy
Teacher Master Document
You are eventually going to use this document with students. Use the document for a whole group activity. Use it to check the assignment answers with the class. Use it for teaching and review. Return to the tab with the original version. This is what I do with my documents when using them with students. I use Google’s Version history. Make sure none of the answers are filled in. Click File and go down to version history. Select the option to name the current version.

set a restore point for the master
Name the version Original and click Save.

set restore point name
Go ahead and fill out part of the document.

fill in the document
Click File and go to version history. Select see Version history.

see version history
Selection the version marked as Original.

select the original version
Click Restore this version. The document with the empty blanks is restored.

restore to the original
Answer key version
It’s nice to have a version for the answer key. Fill in the blanks with the answers. Create a version and name it Answer Key. Go back to version history and retrieve the original version. Retrieve the answer key by selecting it from version history.
Bonus
Turn on the option to show only named versions.

show only named versions
Normal Distribution Curve with Google Sheets
This lesson demonstrates how to use Google Sheets to create a normal distribution, Bell curve, chart. We use data from NOAA. We create a normal distribution chart for all the recorded earthquakes. Along the way we learn to use several statistical functions.

Introduction
A normal distribution curve is one of the more common tools used to analyze information. It is used to represent real values that appear at random. Most of the values tend to fall within the standard deviation.
Use the link below to get a copy of the completed project.
I want to go over some of the fundamentals before creating a normal distribution. These fundamentals are important in the creation of the normal distribution curve.
The curve is created from data represented as numbers. The data represents a population. It can also be a sampling of the population. The population can be anything. It doesn’t necessarily mean population like a count of people. A population is things like the number of scores on an assessment or the number of accidents on state highways. The data are usually large.
The data don’t have to include every occurrence. A representative same is often used. Representative samples are often used on surveys. This is done because not everyone can be interviewed for a survey. The best method is to get a sample of people to take a survey. This sample represents the population from one or more categories. Deciding on the sample data is difficult. We don’t have to do that here.
All collected data have some common characteristics. All data has a Mean, Median, and Mode. The Mean is the average of the numbers or data collected. The average falls in the middle of the numbers. The average is calculated by adding the numbers and dividing the total by the number count. Here is a simple example. We have five numbers. They are 1,2,3,4 and 5. The numbers total 15 when we add them. We divide 15 by the number count which is 5. The average or Mean is 3. We see that the number 3 is in the middle of 1,2,3,4 and 5.
Here is another example. A class of five students took a test. Their scores are 60,65,75,80,90 and 95. The total, when the scores are added is 465. Dividing 465 by 6, the number count gives an average of 77.5. The average doesn't have to be one of the values. The average of 77.5 does fall in the middle of the grades. Somewhere between 75 and 80.
The Median is the value that is exactly in the middle. This is different from the average. We don’t have to do any math to determine the Median. We do have to place the numbers in order from least to greatest.
Here is an example. We have exam scores of 60,70,75,80,85,85 and 90. The Median value is 80. Here is another way to figure it out. There are 7 scores. Add 1 to the number and divide by 2, 7+1 dividend by 2 is 4. The median number is the fourth number in the list.
The Mode is the number that appears most often. We have to place the numbers in order. Here is an example. We have weekly temperatures of 77,79,79,79,80,80 and 85. The Mode is 79 because it is the number that appears most in the list of values.
The range is another important concept. The range identifies the largest value and the smallest value. The Range is the difference between these numbers. The Range in the temperature example is 85 to 77, 77-85=8. The range in these values is 8.
The last concept is the Standard Deviation. The standard deviation is the distance of each value from the Mean. There are a few math steps required to determine the standard deviation. The math isn’t complex.
The first step is to subtract the mean from each value. The answer to each is squared. Add up all the squared values and divide by the count. Finally, we take the square root.
This provides the standard deviation. That is several steps. We don’t have to do all the math. Google sheets will determine the Standard Deviation with a function.
Gathering and formatting the data
The data for our distribution chart come from NOAA. I have used this data before. I like it because it is free and there is a lot of it. I also use it because students like to learn about earthquakes and volcanoes.
Use this lesson as part of a larger project. The link to the data is available below. It is the same data from previous lessons.
NOAA Earthquake database:
https://www.ngdc.noaa.gov/nndc/struts/form?t=101650&s=1&d=1
Google Spreadsheet data:
Query the data
The data we want is in the last column. This column represents the earthquake magnitudes. We will import this column of information into a separate sheet. The data we want is in column H.
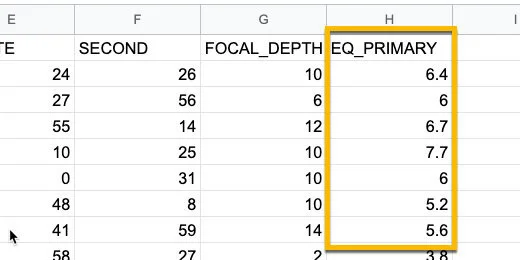
NOAA magnitude data
Click the Plus button next to the sheet name. Rename the new sheet Distribution curve.
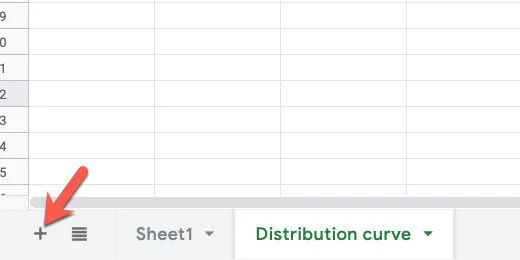
Add a new sheet
Click on cell A1. Type =query(Sheet1!H2:H,”select *”,0).
This is a query function. It is used to import data from another sheet. This query imports data from Sheet1. The data we chose to import starts in cell H2. It goes all the way down to the end.
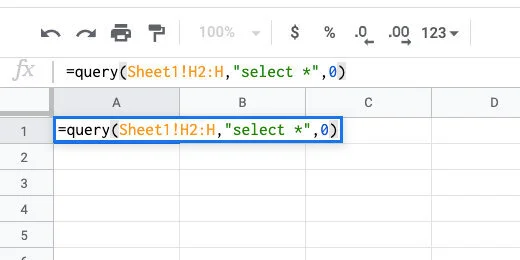
Query the data
Filter away empty values
I want to remove cells with empty values before creating the Named Range. Make sure cell A1 is selected. Click once after the asterisk. Use the formula bar.
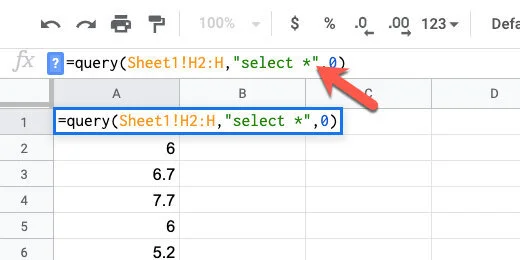
Append to the query
Add WHERE H is not null after the asterisk. This imports information in cells that are not empty. The not null part is referring to the not empty cells.
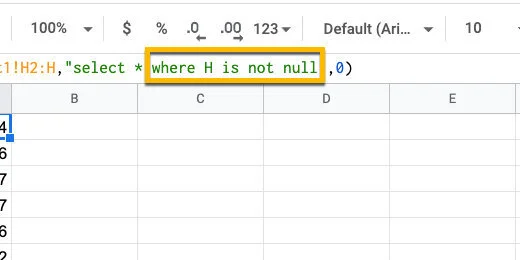
Filter away empty data
Sorting the data
Sorting the data is helpful when looking at the frequency distribution. Type ORDER by H asc after the word null. The content is arranged in ascending order.
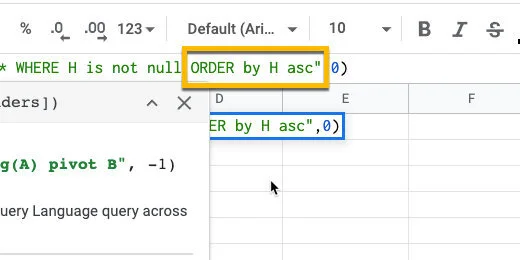
Sort the data in alphabetical order
The sorted data shows there are multiple occurrences of magnitudes. This will appear again when we use the Frequency function.
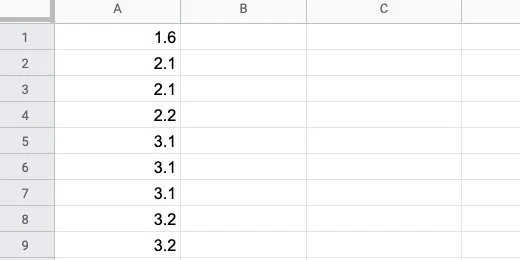
Repetition of magnitudes
Named Range
We are going to use this data several times. To make things easier, we are going to save the data in a Named Range. A Named Range allows us to call the same data with a word.
Click once on cell A1. We are going to select all the data to put into a data range. The easiest way to do this is to use a keyboard shortcut. Press and hold the Shift and Control keys. Keep holding these and press the down arrow once and let go.
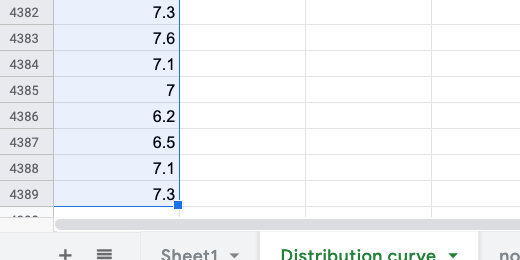
Selected cells for Named Range
Click Data in the menu and select Named Ranges.
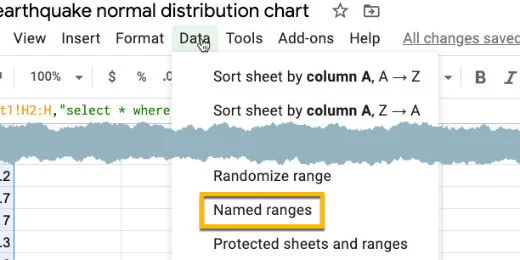
Named Range option
A Named Ranges panel opens on the right. Name the range ‘magnitudes’. Click the done button.
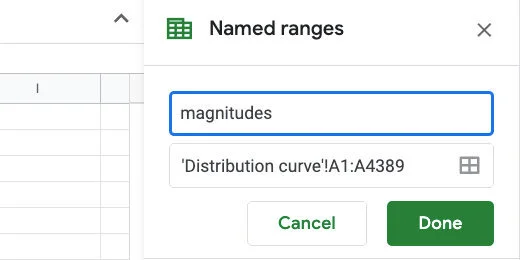
Named Range name set to magnitudes
Scroll back to the top of the sheet. Skip column B. In column C enter the labels for Mean, Median, Mode, and Standard Deviation.
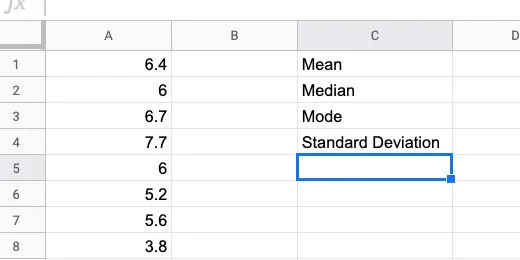
Titles for statistical data
Click in cell D1. Type =AVERAGE followed by an open parenthesis. Google Sheets does not have a function called MEAN. The average is the same as the Mean.
We supply the data range within the parenthesis. The data range is the beginning cell and the ending cell for the data. This is where we use the Named Range.
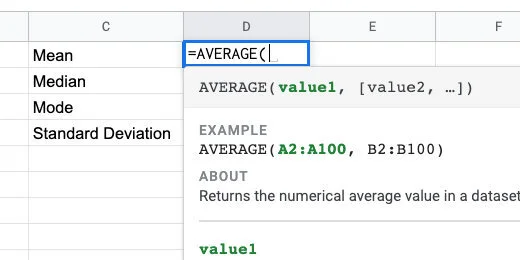
The AVERAGE function
Type magnitudes followed by closing parenthesis. The Named Range appears as a suggestion as we type the name.
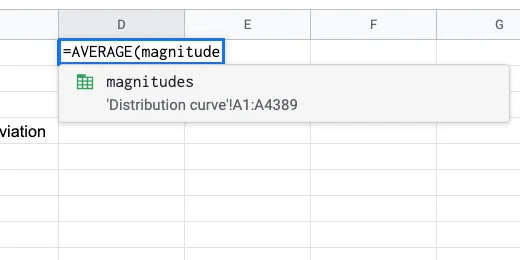
Magnitudes Named Range for AVERAGE parameter
Press the Return key to run the function. The average magnitude for all the recorded earthquakes in our data list is 6.459512417.
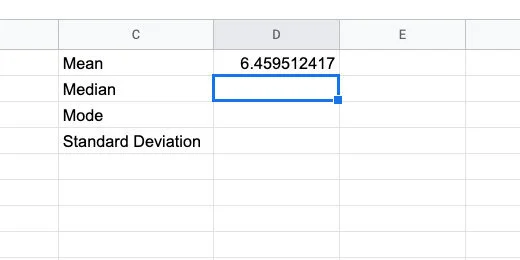
Calculated average
In cell D2, type =MEDIAN followed by an open parenthesis.

Median function
Type the Named Range followed by closing parenthesis.
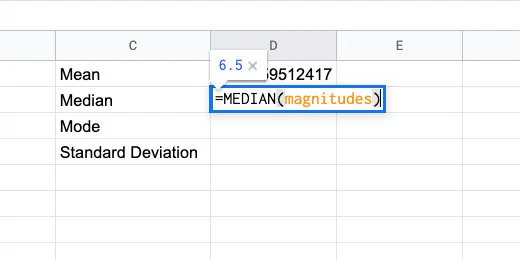
Median function with named range parameter
Type =Mode(magnitudes) in cell D3.
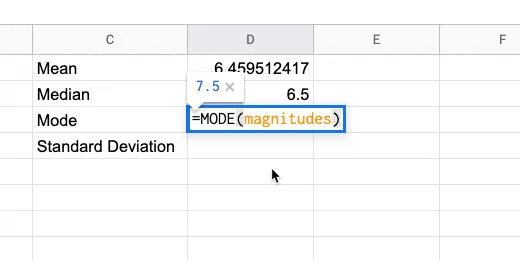
Mode function
Type =STDE in cell D4. There are several options for the Standard Deviation function. We want the standard deviation for our entire population. The function ends with the letter P.
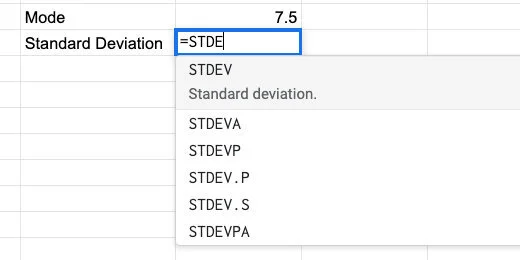
Standard Deviation function
There are two functions that end with the letter P. Use the STDEV.P function and supply the magnitudes Named Range in the parenthesis.
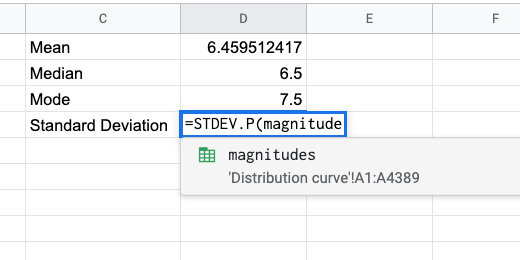
Standard Deviation for the population
These are the values you should see.
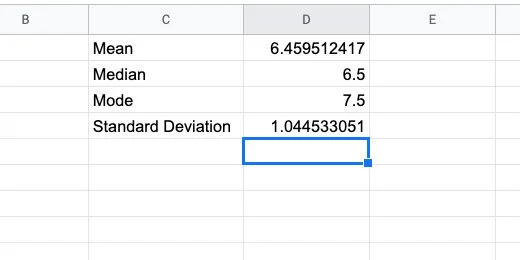
Calculated statistical values
There are two more pieces of information we need. Type Min in cell C5. Type Max in cell C6.
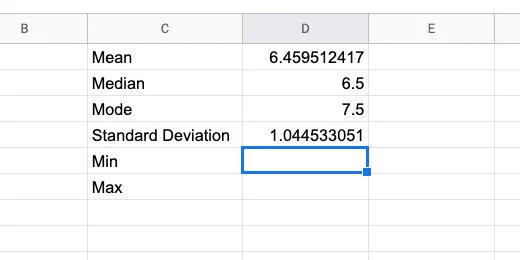
Min and Max titles
Type =MIN(magnitudes) in cell D5. Type =MAX(magnitudes) in cell D6. These numbers represent the smallest and largest earthquake magnitude numbers in our data.
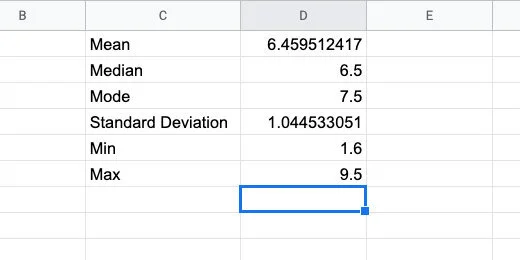
Minimum and maximum values
Skip column E. Type the heading Magnitude in cell F1. Type the numbers 1 through 10 down column F.
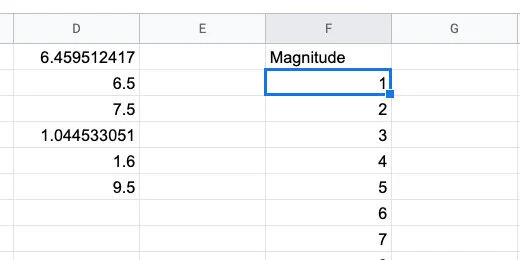
Magnitude data bin
Type Frequency in cell G1. Frequency is the count of how many times a value appears. This is like finding the mode. The Frequency function will count the number of occurrences for each magnitude.
Type =FREQUENCY(magnitudes,F2:F11) in cell G2. This counts the number of times a number between two magnitudes. The function takes the values in the data range and matches them to the classes. The classes in this example are the range of earthquake magnitudes.
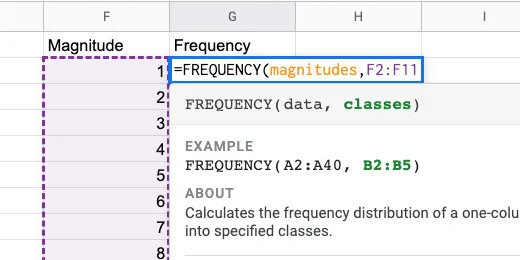
Frequency function
Frequency doesn’t count the exact number that matches the value in magnitude. This is how it works. For magnitude 1, there are no values from zero to 1. Between 1 and 2 there is one value. Between 2 and 3 there are three values. The largest frequency is between 6 and 7 with 1445 values.
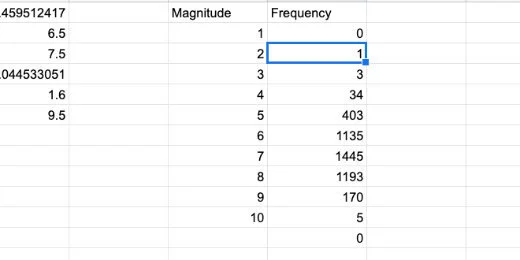
Frequency count for each magnitude in bin
The frequency numbers resemble the distribution curve.
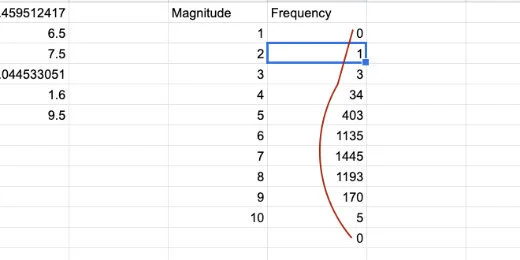
Frequency count resembles distribution curve
Let’s create a graph of this data to compare it with our normal distribution curve. Select the contents of both columns. Be careful not to select the zero at the bottom of the frequency column.
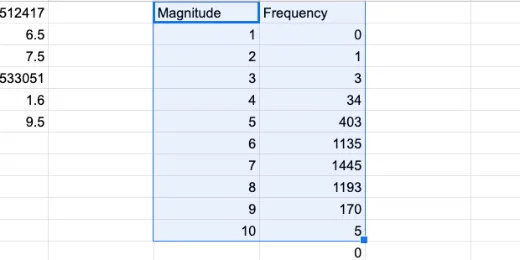
Selection of magnitude and frequency values
Click the Chart button.
Create chart button
This is looking very much like a normal distribution.
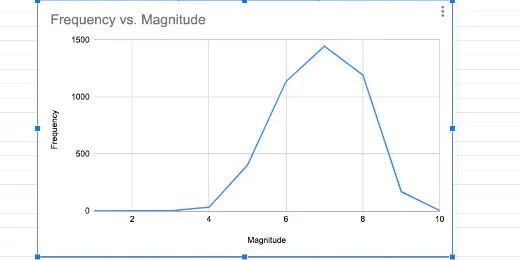
Histogram as line chart
Change the chart type to a column.
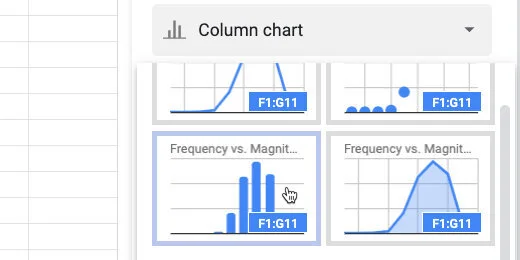
Select column chart option
This is known as a histogram.
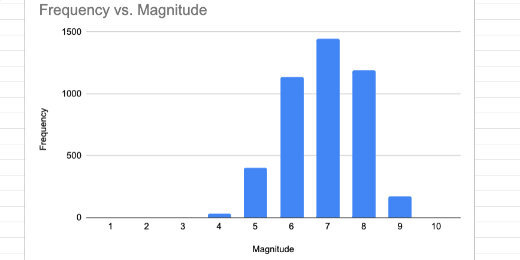
Histogram chart
We will return to this histogram later. For now, we will delete it. Click the actions menu on the chart. Select Delete chart.
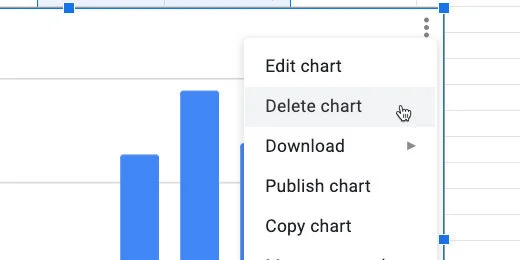
Delete chart
Normal Distribution
We are going to calculate the values for the normal distribution curve. The formula for calculating the normal distribution looks like the image below. We don’t have to go through all those calculations. Sheets have a function that does all the work.
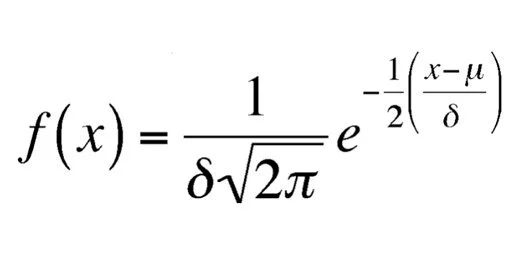
Normal distribution function
Click on cell G1. Right-click on the cell. Select Insert Column.
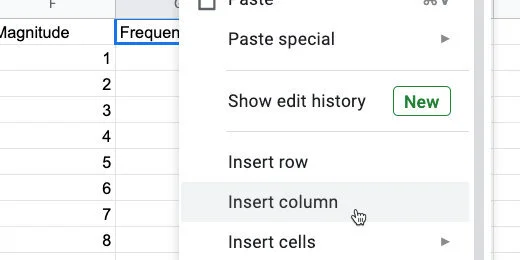
Insert a column
Title the new column Normal Distribution. Type =NORMDIST in cell G2 followed by an open parenthesis.
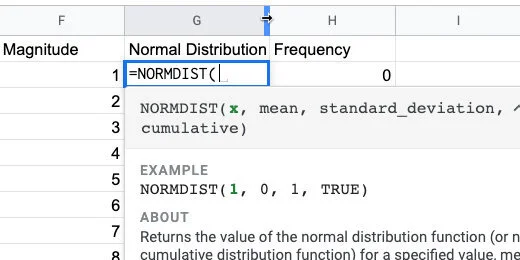
Normal distribution function and parameters
Type F2 after the opening parenthesis. This is the input for the normal distribution function. In our example, that is the magnitude value.
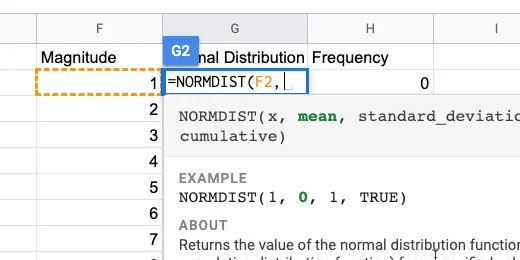
The first function parameter
The mean is in cell D1. We are going to copy this formula down the column when done. The reference to this cell needs to be locked in place. We are changing the cell reference to an absolute cell reference. All cell references are general references.
Type D1 and press the F4 function key on your keyboard. You might need to press the function button before pressing this key. It depends on how your keyboard is configured. The F4 function places dollar symbols before the letter and number.
If you can’t figure out the function key, type the dollar symbol before the letter and number. It needs to be $D$1.
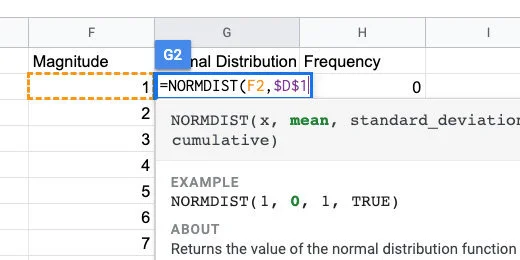
Mean parameter set as absolute cell reference
Type a comma followed by $D$4 for the standard deviation.
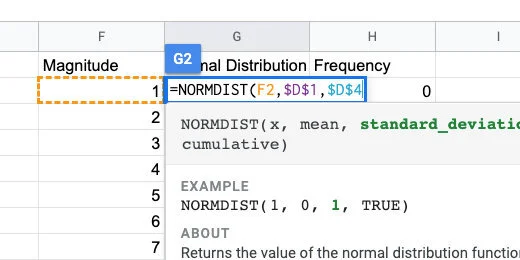
Standard deviation set as absolute cell reference
Type a comma followed by the word FALSE. We don’t need the distribution to be cumulative. Close the parenthesis and press the Return key.
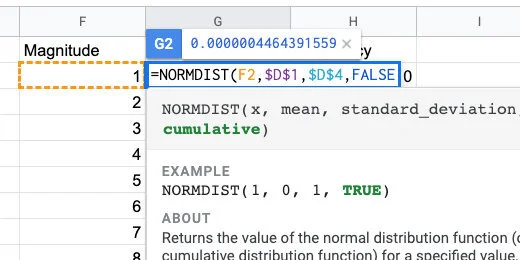
Normal distribution will not be cumulative
Clack on cell G2. Click the blue square and drag it down the column. Stop when you reach the last value for magnitude.
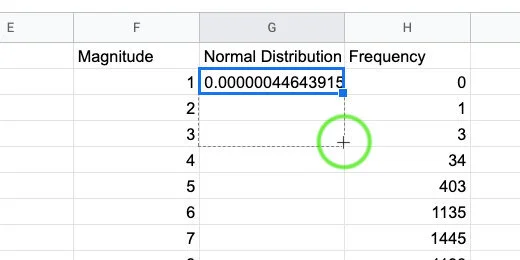
Copy the function down the column
We are ready to create a normal distribution chart.
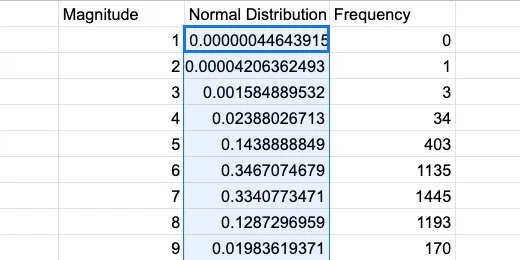
Normal distribution values
Select the contents of the Magnitude and normal distribution columns. Create a chart.
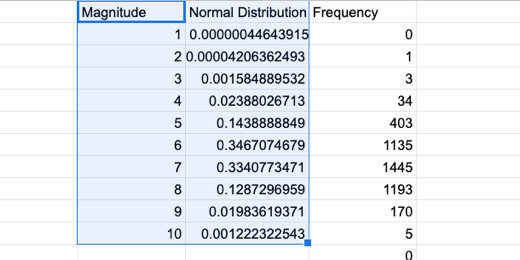
Selection for normal distribution chart
Select the smooth line chart option. We now have our normal distribution curve for the data. At this point, we are done. I would take it a little further.

Normal distribution curve
Compare normal distribution with histogram
Let’s compare the normal distribution with the frequency data. Click in the Data range field.
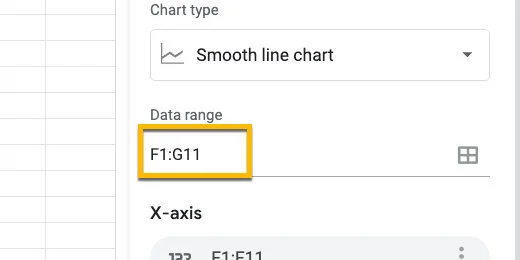
Chart data range
Erase G11 and replace it with H11.
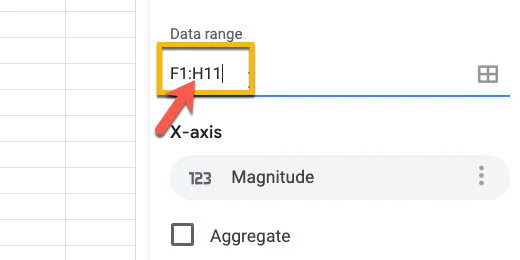
Update chart data range
Go over to the chart editor panel. Click the Add Series button.
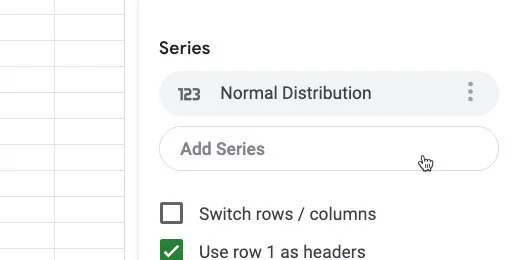
Add a series to the chart
Select Frequency
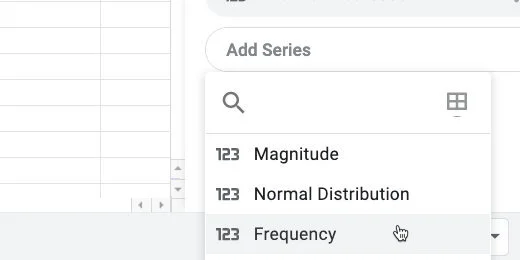
Select the frequency series
Click the chart type selector. Choose the Combo chart.
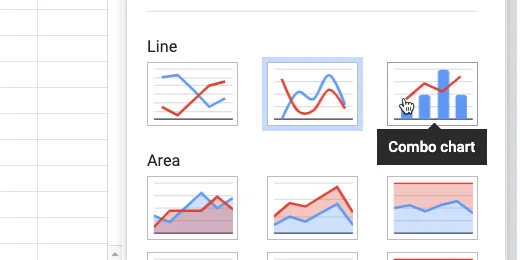
Change chart to combo chart type
Go to the Customize panel. Select the Series section.
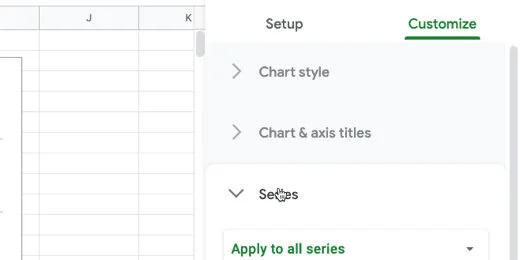
Series section in customize panel
Select the Normal Distribution series.
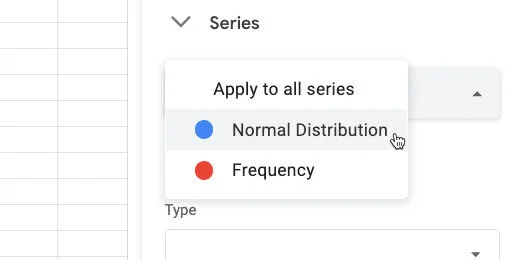
Select norma distribution series
Change the format from Column to Line.
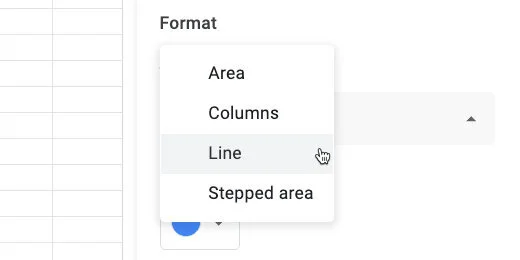
Set chart type to line
Select the Frequency series.
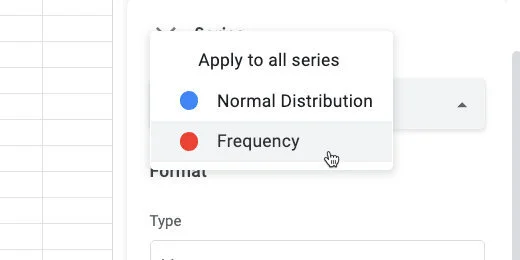
Change to frequency series
Change the chart type to columns.
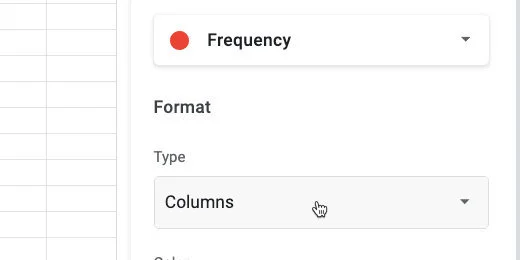
Change chart type to columns
Change the Axis position from Left to Right.
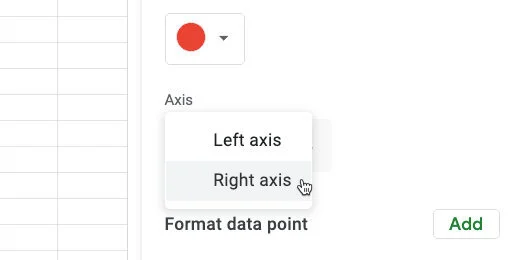
Change axis titles to the right
We see how the frequency distribution compares with the normal distribution. The frequency data is very close to the normal distribution. Some of the bars are outside the distribution curve. This is because we have a very small Bin sample.
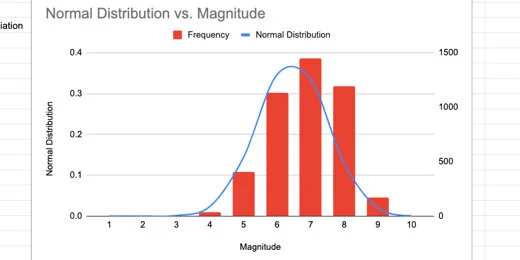
Normal distribution chart and histogram
Enlarging the Bin sample
We are going to increase the Magnitude values to see how that affects the relationship with the charts.
Move the chart off to one side. Click on cell F3.
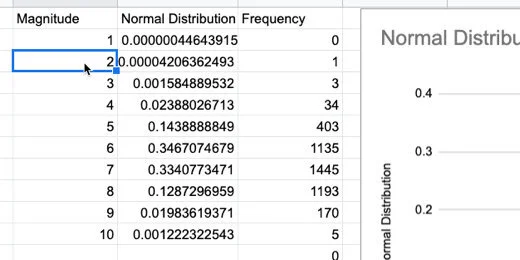
Return to magnitude values
Let's add more information by adding half values. This will include 1.5,2.5,3.5 and so on. Type =F2+.5 in the cell. This gets the value from the previous cell and adds 5.
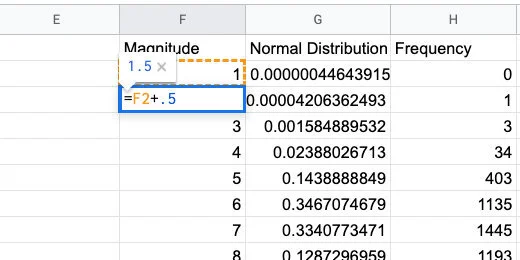
Increment each value by half
Use the blue square to copy the formula down the column. It will replace the values.
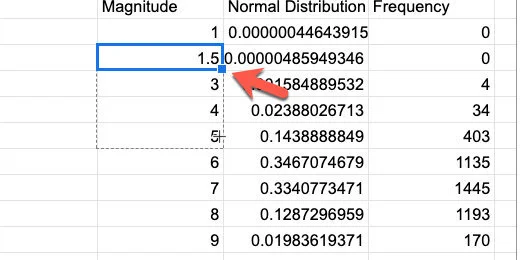
Copy the formula down the column
Keep copying the formula until the value reaches 10. I went down to row 20.
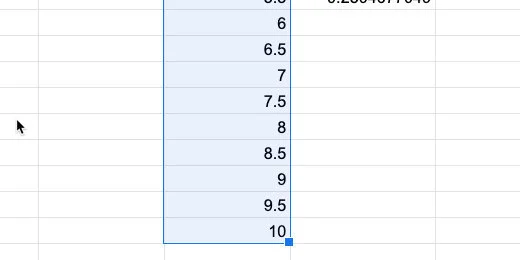
Magnitudes in increments of .5
Go to the normal distribution column. Select the last cell with the formula. Click and drag the blue square to copy the function. Copy it down to match up with the last Magnitude value.
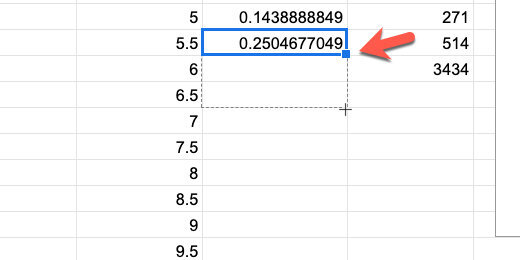
Copy the normal distribution function down the column
We need to update the Frequency values too.
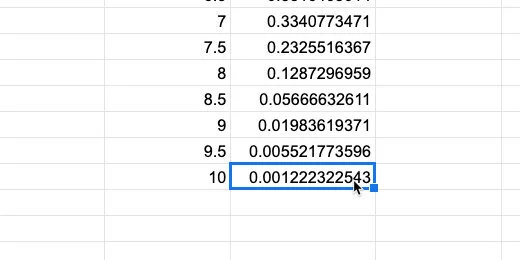
Match the normal distribution to the magnitude values
For the frequency values, we need to update the frequency function. Click on cell H2. Update the function using the formula bar.
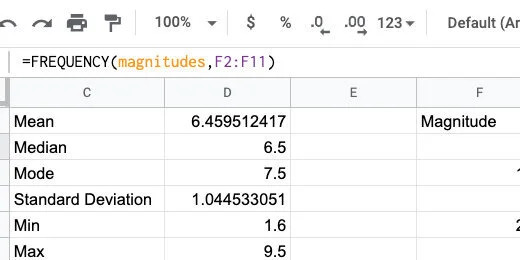
The frequency function in the formula bar
Update the F11 range to F20. Press the Return key.
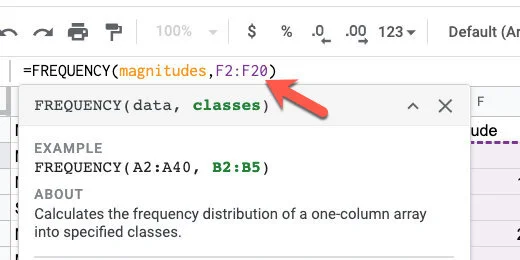
Update the range for the frequency function
We need to update the chart with our additions. Click the actions menu. select Edit chart.
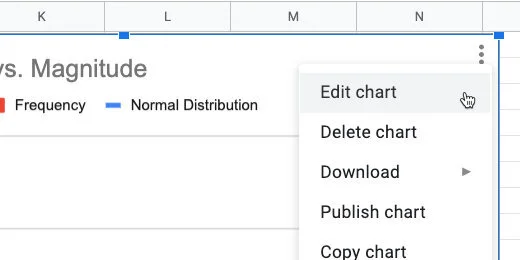
Edit the chart
Update the Data range from H11 to H20.
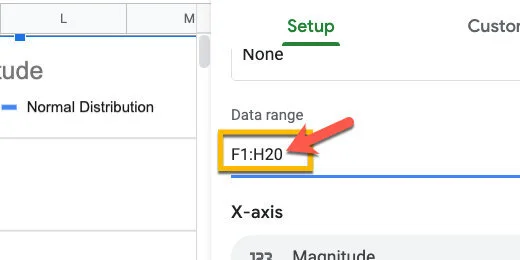
Update the range
More bars from our frequency are fitting within the normal distribution curve.
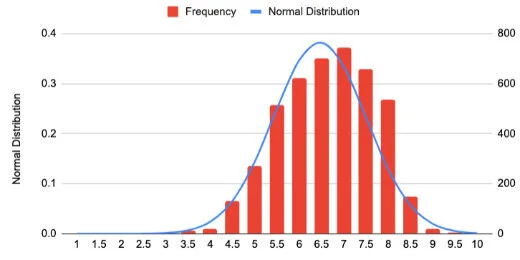
Chart with new values
I updated the values to get information for every quarter increase(.25). More frequency values are falling within the normal distribution curve.
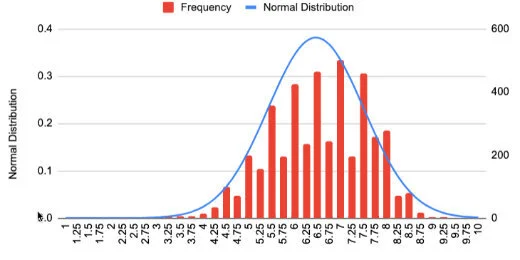
Chart comparison with .25 magnitude increments
Electric circuits and Arduino with TinkerCAD
In the lesson, we create a basic circuit in TinkerCAD. We create a basic LED circuit. We combine the basic circuit with an Arduino microcontroller. We use the microcontroller to turn the LED ON and OFF. We take it one step further and program the LED to blink. A good lesson to learn the fundamentals.

Coding Circuits With Arduino in Tinkercad
An Arduino is a microcontroller. A microcontroller is a very simple computer that accepts basic code. It translates that code into instructions that interact with the physical world. In this lesson, we will use a microcontroller to act as a switch.
Click the link below to see the completed project.
https://www.tinkercad.com/things/3sufhjgf15T
Create a new circuit in TinkerCAD. Add a Breadboard to the work area. Place one LED on the Breadboard and place two jump wires. Connect one jumper wire to the positive rail. Connect the other to the negative rail. Make sure to connect the anode to the positive lead and the cathode to the negative lead. The Anode on the LED is the the one with the bent wire.
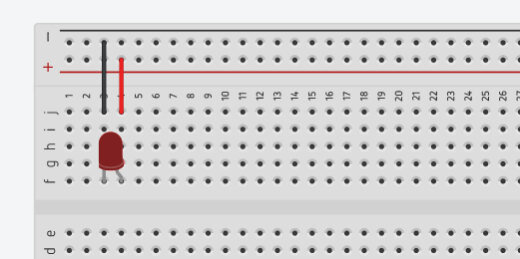
LED on breadboard
Click on the Components button and find the Arduino Uno R3 microcontroller.

Arduino Uno R3 component
Place the microcontroller to the left of the Breadboard. Several components are part of the Arduino board. Let’s look at a couple of these components.
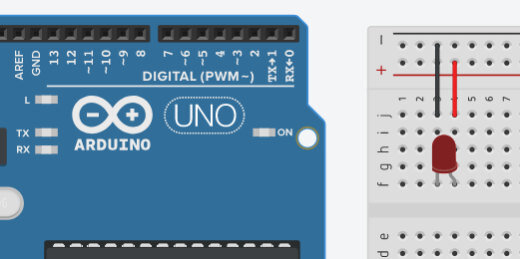
Arduino alongside the breadboard and led circuit.
The holes along both sides of the board are GPIO pins. This stands for General Purpose Input/Output pins. Each is a connector that links to our Breadboard with a jumper wire. Most of these are with a number. These numbers identify the pins in our code. The code we develop on the board can reference these pins as either input or output. There is one connector labeled GND. This is the ground connector or the negative terminal in our circuit. The Arduino provides coded instructions to the components on the board. It also provides the necessary current to make the components work. The GND is the same as the negative terminal on a battery. The other connectors marked with a number are the same as the positive terminal on a battery.
A physical Arduino board connects to a five-volt power supply from a computer USB port. The Arduino itself supplies the same 5 volts to components. For some components, this is too many volts. In our example, the 5 volts will destroy the LED on the Breadboard. We will be adding a resistor to limit the amount of current going to the LED.

GPIO PINs on Arduino
Connect a jumper wire from the GND connector on the Arduino to the negative rail on the breadboard. Take another jumper wire and connect it from the number 3 GPIO to the positive column. I moved the board so you could see the connections. I also color-coded the wires.

Jumper wires from breadboard to Arduino.
This isn’t enough to turn on the LED. We need to do a few more things. Click on the Code Editor button.

Code editor button
A coding panel will open at the bottom of the page. We use blocks to develop code. Like the blocks used in Code.org or Scratch. There is already a program in the editor. This is the standard code included each time we place an Arduino board onto the workspace. This code instructs the LED on the Arduino board to blink. This is not the LED on our Breadboard. The Arduino has a small LED on the board. Click the Start Simulation button to see the LED on the board blink.

LED code block for Arduino.
The blinking LED is on the left side of the Arduino logo. Stop the simulation.
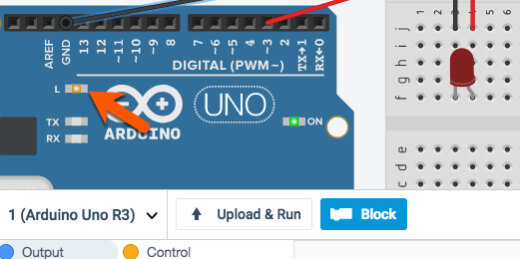
Blinking LED on Arduino board.
We don’t need this code. We want to control the LED on the Breadboard. Click on the first code block and drag it to the trash can icon. This takes everything that is connected to it.

Removing the standard LED code.
We need a little more room to code. Move your mouse pointer to the top edge of the coding panel until you see the arrow change. Click and drag up to expand the coding panel.

Widen the code area.
The coding panel has different sections of code. We will be using code blocks in the Output section. Drag the set pin code onto the coding canvas.
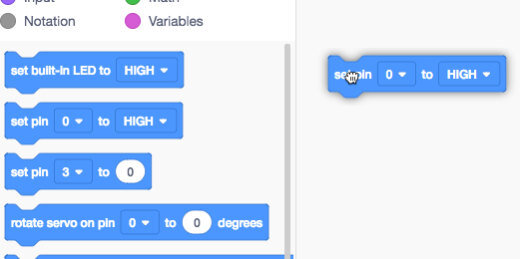
Set pin code block onto canvas.
Most code blocks have options. This code block includes a PIN and a state. The PIN references the connector we used to send current to on the Breadboard. This is the positive jumper wire we connected earlier. We connected the wire to pin 3. The options in the code block are arguments.
The term argument comes from mathematics. The argument of a function is a specific input to the function. It is an independent variable like the pin in our code block. This code block has two arguments.
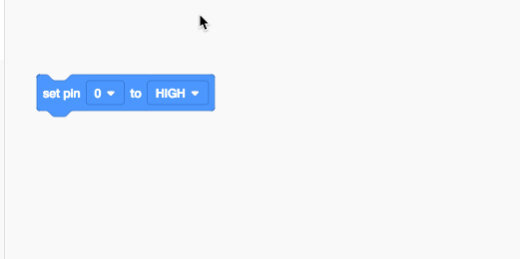
Set pin code and parameters.
Change the pin to 3. The second argument has two states. A state has one of two options. A state can be on or off. The state is set to high. A high state is the same as ON. The other option is a LOW state. This is the same as OFF. Computers read everything as either ON or OFF.
That’s all we need to get started. Click the Start Simulation button. Resize the code block panel to see the LED.

Parameter set to pin 3.
The LED will change color to show that it is on. There is an exclamation mark next to the LED. This exclamation mark is a warning. The current going through the LED is too high. In the simulation, we get a warning. In a physical board with a real LED the LED would burn out and won’t work again. This is why testing or prototyping is useful. LEDs aren’t expensive but expensive enough that you don’t want to be burning them out all the time.
To avoid burning out LEDs we need to use resistors. Resistors restrict the flow of current to components. Every circuit includes voltage, resistance, and current. Current is the part of the equation that does all the work. Think of electric Current like water flowing through a river or stream. Resistance is the width of the river or stream. Narrow streams have more resistance than wide streams.

LED light with warning.
Stop the simulation and close the code editor. We need to make room for the resistor. Move the LED to the other side of the board. Place it in column A.

Changed position of LED on breadboard.
Open the components panel and find the resistor.

Resistor in component panel.
Place the resistor so it bridges the gap between the two halves of the board. Make sure the resistor is in the same row as the anode and the positive jumper wire.

Resistor on breadboard.
The row connections do not span across the board between E and F. Add a jumper wire to complete the circuit.

Jumper wire to complete circuit.
Run the simulation and the LED should light.
Blinking LED
The code we used in the previous example turned the Arduino into a glorified switch. We can do so much more with Arduino.
Click the code editor button to open the coding panel. Click the Control code block category and look for the wait code block.
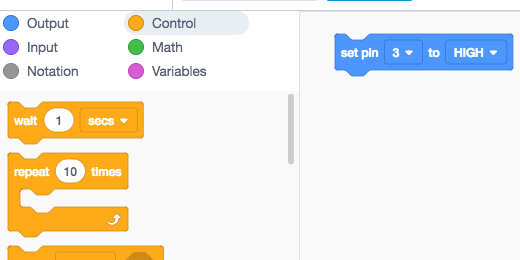
Wait code block.
Place the wait code block below the set pin code block. The wait argument is set to one second. Leave the argument at this value. Go back to the Output code block category. Place another set pin code block onto the canvas below the wait code block.

Second set pin code below wait block.
Set the pin value to 3 and the state to low. Run the simulation. The LED will turn ON and OFF. The OFF state is too short. Arduino is a very simple computer but it is still very fast. It processes our instructions in fractions of a second. We need to instruct the code to slow things down so we have time to see the changes.

Set pin block with updated parameters
Go to the scripts panel and find a wait code block. Add a wait code block after the last pin code blocks. Leave the wait value at one. Run the simulation again. The LED will turn on and off over and over again. The code we write does not include a loop function but the Arduino repeats the code anyway.

Second wait code block
The code blocks we use are representations of written code. The written code is on the right side. The code has two main sections or functions. The void setup function sets pin 3 as the output pin for the instructions.
The void loop function is where we write the main part of our code. The void loop repeats the code until the simulation stops. On a physical Arduino, we need to turn the power OFF.

The script represented from the code blocks
The void loop instructs the board to set the power to pin 3 to high or On then wait one second. After one second the power to pin 3 is set to low or turned off and then wait one second. The instructions repeat all over again until we stop it by removing power from the Arduino board.
Create Class OneNote Notebooks with Microsoft Classroom
Microsoft Classroom Notebook makes a great companion for Microsoft Teams. In this book, you will learn how to create, distribute and manage student OneNote notebooks. With OneNote Notebooks you can distribute and collect assignments from students. The collection process is seamless.

Introduction
A Class Notebook can be accessed with the OneNote application once it has been created with the Cloud service. OneNote is available for a variety of devices. These devices include Windows desktops, laptops, Surface tablet, iPad, iPhone, Chromebook, and various Android devices.
A Class Notebook includes three sub-notebooks. These notebooks include Student Notebooks, Content Library, and Collaboration Space. The Student Notebook is a notebook that is accessible to individual students and to the teacher. Student notebooks aren't viewable by other students. The Content Library notebook is a notebook where teachers can share material with students. The content in this notebook cannot be edited by students. The last notebook, Collaboration Space, is used for teachers and students to work on collaborative assignments and projects. This section can be edited by teachers and students. All these notebooks are created at the end of the setup process we will be going through in this first lesson.
Creating A Class Notebook
To create a Class Notebook, log into your Office 365 account and click on the application launcher. The application launcher is usually available from within any of the Office 365 online applications like Outlook. The launcher is located in the upper left corner of the page.

Office 365 application tiles
Click on the Class Notebook tile.

Office 365 Class Notebook application
The Class Notebook page will open. The page has four tiles to help create and manage Class Notebooks. Click on the “Create a class notebook” tile.
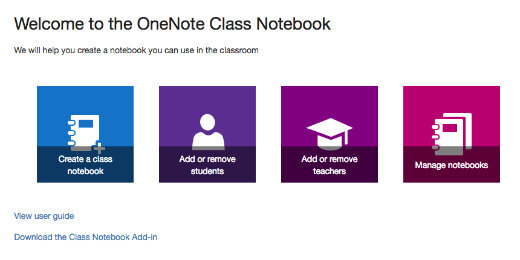
OneNote Class Notebook portal
A series of steps will be listed on the left side. Office 365 will guide us through the process of creating a Class Notebook.

Class Notebook creation process
Provide a name for the class or content that is to be taught. The name of the notebook can be anything relevant to instruction. Special class notebooks can be created for special projects like science fairs or projects. Click the next button.

A message page will inform us that several notebooks will be created. Click the next button.

Overview of content to be created in each notebook
We have the option to include other teachers in this notebook. This is an opportunity to provide the names of other teachers or aides that will be either co-teaching, supporting, or providing instructional content for curriculum and lessons. These teachers will have the same access to the notebook as the teacher that creates the notebook. This means they can view student notebooks and access common classroom sections like the Content Library and Collaboration Space. Teachers do not have access to other teacher notebooks, which are also created during this process. Provide the email address of other teachers if this Class Notebook is going to be shared with another teacher in the organization.
Teachers don't need to be entered at this time. Teachers can be added later in the Manage Notebooks section. We will cover this step later.

Add teachers to notebook management
The next step in the process is to provide the email address of students that will need access to this notebook. Each address can be entered individually or pasted from another application. If the addresses are going to be pasted, each address must be separated by a semi-colon.
Student emails don't have to be entered at this time. It might be better to create the notebook and set up everything before students are invited to the Class Notebook. Students can be added later using the Manage Notebooks section.
If student email addresses aren't available yet, or if you don't want to add students now, click the next button.

Add students to Class Notebook
Class Notebook creates four default sections in each student notebook. These include handouts, class notes, homework, and quizzes. We can add more sections at this time by clicking the “Add more” button. Sections are places where students can create their content for teachers to review and grade. It also provides a way for teachers to help students organize their work and for teachers to quickly access student assignments. Additional sections can be added later in the Manage Notebooks section. We’ll use these default sections and click the next button.

Default sections for each notebook
Click the “Create” button to finish the process.

Overview of content created for notebooks
The Class Notebook is ready and can be opened with OneNote. The OneNote application can be installed on a computer or device. Notebooks can also be opened with OneNote online, which is the Cloud service option for OneNote. Click the option to open OneNote online.

Open OneNote online
OneNote online will open in a browser and display a welcome page. The notebooks section contains a list of notebooks created under the Class Notebook. In this example, that would be the Physical Science notebook. The Notebooks section includes Collaboration Space and Content Library. Each has information and instructions for using the notebook. Click on the Notebooks link.

OneNote online with teacher notebook
The Notebooks page will open, which contains Class Notebooks and personal notebooks.

Class Notebooks management section
Clicking the Class Notebooks menu option will list the Class Notebooks only. Click the Class Notebook link.

Class notebooks list
Each notebook has pages for taking notes. There are several pages created for us with each Class Notebook. These pages contain information for using the notebook. To create a new page, click the “+ Page” link.
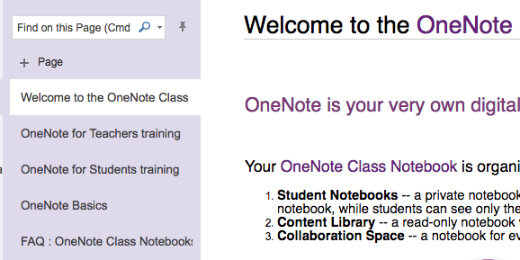
Default pages in teacher notebook
Once the page is created, a cursor will be placed at the top of the page to provide a title. This title will appear in the pages panel for easy navigation to each page.

New page
Press the Return key on the keyboard or click below the title to begin adding content.

Page title and content area
Student Notebooks In-Class Notebook
Student notebooks appear in the Notebooks panel. These notebooks are automatically created and added when student accounts are added to the Class Notebook. They are listed in alphabetical order below Collaboration Space and Content Library.

Teacher view of student notebooks
Click on the disclosure triangle to view the contents of each student’s notebook. Each notebook contains the default sections that were created during the setup. Each section has its own set of pages. Sections are notebooks within a notebook.

Sections in student notebooks
Any work that is done in either the online, desktop or mobile device version of OneNote is automatically saved and synced to the Office 365 Cloud.
Google Slides for distance learning
Google Slides provides a variety of presentation options. Most of these options are available because it is a native web application. The presentation options lend themselves very well to distance learning. Students members get a copy of the presentation and presenter notes. This is also very useful as a distance learning resource.

Introduction
Google Slides provides a variety of presentation options. Most of these options are available because it is a native web application. The presentation options lend themselves very well to distance learning. Students members get a copy of the presentation and presenter notes. This is also very useful as a distance learning resource.
In this lesson, we are going to share a presentation with students. We will use the Q&A option to collect audience questions and get feedback.
Sharing presentations
Sharing presentations with Google Slides provides flexibility for teachers and learners. Teachers share their presentations with students. Students follow along with the presentation using their device. Teachers don't need a presentation screen. This is useful in traditional classrooms and distance learning.
Presenter notes and links are available to students. Updates to the presentation are immediately available to everyone.
There are various ways to share Google Slides. I prefer to share them on a Google Site. Before we get to that, I want to show you other ways to share presentations with students.
Open a slide presentation and click the Share button.
Google Slide share button
Click Get shareable link.
Get shareable link
There are various ways to share the link with students. For example, share the link through email or social media. The link provides view-only access. They won't be able to make any changes to the presentation.
Google Classroom is a better way to share presentations with students.

Shareable link with as view only
Google classroom is not just for students. Use it in professional development environments. I use it all the time.
Sharing with Google Classroom
Go to an existing Google Classroom you created or create one. Click the Classwork section.

Google Classroom Classwork section
Click the create button. The slide can be shared as an assignment, quiz, or question. When using it for a presentation I like to share it as classroom Material.

Create Material option
Provide a title. Include a brief description of the slide if you can.

Title and description for material
Click the Add button and select Google Drive.

Add content from Google Drive
Find the slide and double click to add the resource.

Select the Google Slide to share
Click the Topic selector. Create a topic for the material. Topics provide a useful way for students to quickly access materials.

Create a topic for the resource
I create topics with subtopics. The subtopic appears after the vertical bar.

A topic with subtopics separated by bar
Click the Post button. Students will find the material resource in the Stream Section.

Post button for material
The presentation opens in a tab when students click the shared link. It doesn't open in presentation mode. Students click the Present button to view the slides as a presentation.

Google Slide open in view only mode
Sharing with Google Sites
Google sites is another way to share material with students. Google Sites is a wonderful companion to Google Classroom. It forms the trilogy of Google Classroom, Drive, and Sites. I use a Google Site as part of my classroom resource. The link for the site is one of the resources in my Google Classroom.

Google Site shared as resource in Google Classroom
The slide is embedded in the site under one of the resource pages. The embedded slide provides a good visual for students. The first slide provides the thumbnail. The first slide should, therefore, include the title and relevant information.

Embedded Google Slide in Google Site page
This is how I embed the slide. Select a page where the slide will reside. Go to the Insert section.
Insert panel in Google Sites
The embed slides option is near the bottom of the insert list. I prefer to use this option because it filters for Slides.

Insert Slides option
Select one or more slides and click the Insert button.
Select Google Slide for embed
Each slide is placed in a separate row.

Google Slide on site page
Click and drag slides around the page to place them side by side.

Drag and drop slide to reposition
Click the Preview button.

Preview the Google Site page
Students interact with the slide through the controls in the thumbnail. They move forward and back through the slides. They jump to a slide using the selector.

Control options on Slide preview
The full screen button displays the presentation on the device's display. It opens in presentation mode.

Full screen button on Google Slide preview
The pop-out button opens the slide in another tab. The slide opens in presentation mode.

Open in tab button
Questions and Answers
Google Slides has a Question and Answer option. It is typically used by the audience to ask questions of the speaker. The speaker then answers the questions after the presentation.
In the classroom, I often reverse the process. During the presentation, I ask questions or feedback from students.
Click the selector next to the presentation button. Select the first option.

Present with Q&A option
A tab opens with the slide thumbnail in a panel on the left. Speaker notes are available on the right. Click the Audience tools tab.

Q&A page for presentation
Click the Start new button at the bottom of the page.

Start at new Q&A session
The presentation is now accepting questions. A link to the questions page is provided. This link is shared with the audience on the slide.

Link to Q&A page for slide
The link appears above the slides. Students click the link to open the Q&A page.

Q&A link above each slide
Questions and comments
Students are presented with a question box.

Ask a question box
The student's name is included in the question. There is an anonymous option for shy students.

Question includes user name or send anonymously
Students click the submit button to submit their questions or feedback.

Submit button for question or comment
The question appears on the page for all students to view. The question includes like and dislikes buttons. Students with the same question click the like button. This helps you address the question that is most on student's minds.

Like or dislikes button for question
We see the question and the number of likes. The question has two likes. This does not include the original post. That makes three students that have the same question. Note that the name of the original poster of the question is the only name that appears.

Present button to display question for audience
Each question includes a PRESENT button. This button displays the question over the current slide. Click the button and take a look at the live presentation.

Question displayed over slide
Click the next Present button to display the next question. The previous question is hidden. Click the hide button to stop displaying a question.

Hide button to hide question after responding
Student feedback
Students are not the only ones that can ask questions. Use the link to pose your questions.

Teacher asking for feedback with question
This is a good way to get feedback for a formative assessment. I like asking true/false questions. Students "like" if it is true or "dislike" if it is false.

Question posed as true or false
Use the Present button to display the question for students.

Teacher question displayed for students
Stop accepting questions
The question page remains active. This is true if you close the presentation and the browser. Students can still post questions. I recommend you always close the Q&A session. Toggle the question session to off.

Stop accepting questions button
Reviewing the Q&A sessions
The Q&A session is saved with the slide. It is saved in the audience tools tab. Go into presentation mode and select the Q&A option.

Presenter view with Q&A
Click the Continue recent button.

Continue recent Q&A session button
All the Q&A sessions are listed. Click the continue button for a saved session.

Continue button to view or continue previous Q&A session
The session opens and is activated to begin receiving responses.

Q&A session is automatically enabled
Multiple Q&A
Teachers with multiple periods are likely to present the same information multiple times. This is where we can start a new session. Click the Start new session button.

Start multiple Q&A sessions with Start new button
Each Q&A session has its own unique Q&A link.
Each Q&A session has a separate Q&A link
The date and time for each session are saved and listed in the Recent sessions list.

Each session with date and post time
Comparison Line Charts
In this lesson, we are going to create a chart that plots the data for two time periods. These periods range from 1998 to 2008 and 2009 to 2019. The chart is useful when making comparisons. We will be able to see twenty years of data and compare decades of earthquakes.

Comparison line charts with Google Sheets
Introduction
In a previous post, we learned to create a basic line chart. We used information from NOAA on recorded earthquakes. The graph charted the number of earthquakes that took place over a ten year period.
In this lesson, we are going to create a chart that plots the data for two time periods. These periods range from 1998 to 2008 and 2009 to 2019. We will be able to see twenty years of data and compare decades of earthquakes.
Comparison Line chart
The data for this lesson is available from NOAA. It is also available as a filtered version from my link. This is the data we will use to create the chart. You don't need to go to my first lesson on the line chart to follow along. I will go over everything from the beginning. Use the link to get a copy of the data.
NOAA Earthquake database:
https://www.ngdc.noaa.gov/nndc/struts/form?t=101650&s=1&d=1
Google Spreadsheet data:
Gathering the data
Create another sheet for the line chart. Click the add sheet button. The button looks like a plus sign. It is next to the sheet name.

Double click the sheet name. Change the name to "comparison line chart".

We are going to import the data we need for the chart. I know this is an extra step but it teaches you a few more skills. I love teachable moments. Click once on cell A1.
We are using a function called QUERY. This function imports data from other sheets. Functions and equations begin with an equal sign. Type an equal sign followed by the word QUERY.

The function needs parameters. These parameters are placed inside of the parenthesis. Type an opening parenthesis. Don't add a space between the word QUERY and the parenthesis.
Google Sheets provides useful information about the parameters. The first thing we need to do is point to the data we need to import.

The data is in the adjacent sheet. To point to this sheet we type the name of the sheet. Type Sheet1 followed by an exclamation mark. The exclamation mark is used to identify the name as the name of a sheet. The exclamation also serves as a separator between the sheet name and the data range.

We need the column that contains all the years for earthquakes. That is column A. The information begins with the first row and goes down for hundreds of rows. Type A1 and a colon. The colon is used to separate the first cell in the range from the last cell in the range. The last cell is hundreds of rows down. Instead of using the number for the last row, we can simply type the letter A after the colon. This instructs Sheets to get the data from cell A1 and go down the column to the last row with data.

We are done selecting the data. Type a comma to separate the parameter from the next. In the next parameter, we need to identify the information we want to import. Normally we would limit the import to specific data. I want to import everything and then filter it using different tools.
Type opening quotation marks followed by the word select and an asterisk. The asterisk is known as a wild card symbol. In this case, it is referring to everything. We are selecting everything in the column. Type closing quotation marks followed by a comma.

The third parameter identifies if the data includes headers. The header is the title at the top of the column. Type a number 1 to inform the function that the first cell has a title. Type closing parenthesis. Press the Enter key.

We are going to count the earthquake events every year. Skip a column and go over to cell C1. Type 1998 to 2008.

Go to cell C2. We are going to write the individual years. Begin with 1998 and enter a year in each cell down the column.

Go to cell D1 and type Quakes.

In the cells next to each year, we will count the number of quakes. Sheets will do this with another function. Type the equal sign followed by COUNTIF.

The COUNTIF function is used to count the number of occurrences. It will count something if it matches the criteria. The function needs two parameters. We need to tell it where the stuff to count is located. We need to tell it what to count. Type an opening parenthesis.

We need to pass in the range for the first parameter. The data we want to count is in column A. A Range needs a starting and ending value. Type A2:A for the Range. The Range begins at A2 because we don’t need to count the title. The ending Range is open so it includes the last row with data. Type a comma to separate the first parameter.

We want to search for the year. The year is in the adjacent column. In the parameter, we will point to this column. Type C2 and a closing parenthesis. Press the Return key.

We see that in 1998 there were 32 earthquakes.

We need to repeat this for the remaining years. We don’t have to manually enter all the functions. Google Sheets will help us. Click back onto cell D2. Click the little square in the lower right corner and drag it down. Stop when you reach the last year.

The number of earthquakes from 1998 to 2008 is ready. We are going to use the same process for the years 2009 to 2019.

Go to cell F1 and enter the title for 2009 to 2019. Enter the years down the column. Place the Quake title in cell G2.

In cell G2 type the function =COUNTIF(A2:A,F2). Copy the function to the corresponding cells.

Constructing the chart
We will begin with a simple line chart. Select the data set for the years 2009 to 2019.

Click the insert chart button.

Google should create a line chart.

The chart setup section shows the series that is being plotted. The series name is based on the title in the column. Click the Add series button.

The data for the years 1998 to 2008 is in column D. The data range is D1 to D12. Enter D1:D12 for the series Range. Click the OK button.

The data for both series is plotted. It’s difficult to understand the chart without more information. We will begin by changing the series names. Click in cell G1 and change the title to “2009 to 2019”. Change the title in D1 to “1998 to 2008”. Change the titles in cells C1 and F1 to Years.

The chart updates with the changes. That makes a little more sense.
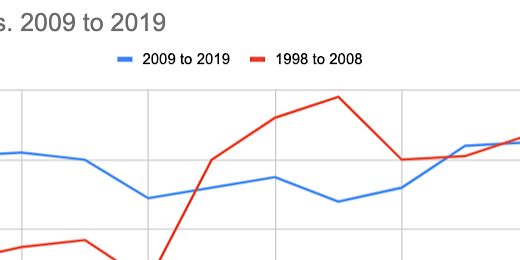
The titles along the horizontal axis show the labels for 2009 to 2019. The line for this data should stand out against the comparison line.

We are going to switch to another line chart format that treats each line as a separate graph. Click the chart selector. Choose the combo chart.

One of our lines is converted to a bar chart. No problem, we will change it back.

Switch to the Customize tab. Go to the series section. Select the series that is converted to a bar chart.

Change the format from Columns to Line.

Switch over to the 1998 to 2008 series.

Change the line color to a light blue. Change the line type to dash.

Switch to the 2009 to 2019 series. Change the line color to a dark blue.

Scroll down a little and click the Data labels option.
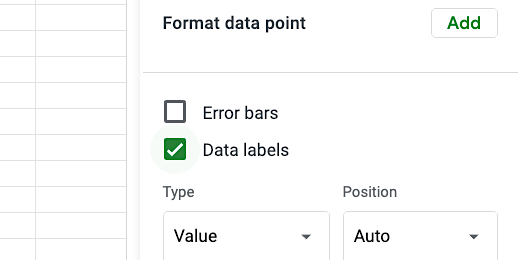
The chart is starting to come together.

Go to the Chart style section. Enable compare mode. Compare mode provides additional information when we hover over a data value.

Close the chart editor. Hover the mouse arrow over one of the data points. The comparison information is useful.

Edit the chart title. Change it to read Earthquake Comparison By Decade. The comparison chart is done.