Technology lessons for educational technology integration in the classroom. Content for teachers and students.
Change the brightness of an LED with TINKERCAD and Arduino
In this lesson, we explore how Pulse Width Modulation works in a circuit connected to a microcontroller. I am using a virtual circuit constructed in Tinkercad. A microcontroller in Tinkercad, an Arduino, will vary the brightness of an LED. The brightness is adjusted with code entered into the microcontroller. The microcontroller uses Pulse Width Modulation to simulate various levels of illumination on an LED. We will see how pulse width modulation actually works by connecting a virtual oscilloscope to the circuit.

Introduction
In a previous article, I posted a lesson for using TinkerCad to construct a basic LED circuit. The LED in the circuit is turned on or off using an Arduino and a few lines of code. We used code to instruct Arduino when to turn the LED on or off. That’s as far as we got in that lesson. The link to the lesson is below.
https://digitalmaestro.org/articles/electric-circuits-and-arduino-with-tinkercad
In this lesson, I want to take the same instruction one more step. In the previous lesson, the LED was either on or off. We had no way of adjusting the brightness. We are going to address that option in this lesson. The link to the completed project is available below.
https://www.tinkercad.com/things/iOxi8dvvqMP
For this lesson, you need a TinkerCad account. The account is free. Go to tinkercad.com if you don’t have one.
New Circuit
Go over to tinkercad.com and log in. Click the circuits button. The button is in the menu on the left. Click the create new circuit button.

Click the random name assigned to the project. Change the name to variable led brightness.

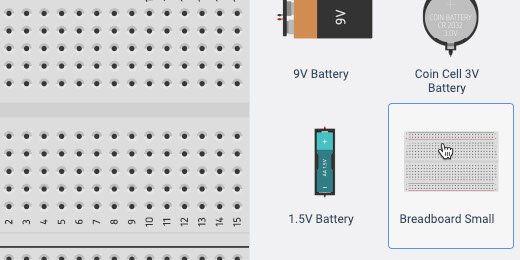
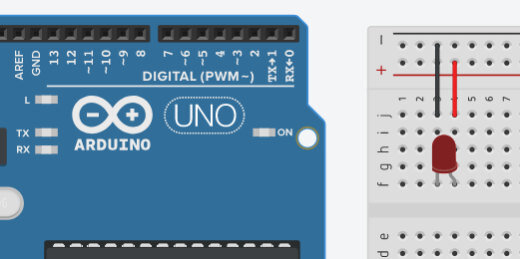
Find the small breadboard in the components panel. Drag it onto the canvas.
Find the LED component.

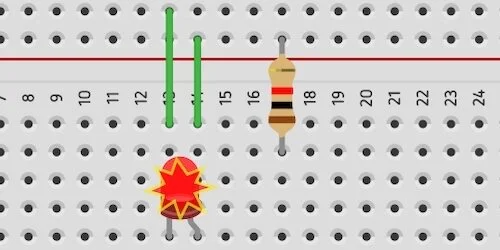
Place the LED on the breadboard. Place it somewhere in the middle. Leave space to attach wires above and below the connectors.

Find the resistor in the components panel.

Place the resistor across the upper and lower halves of the breadboard. Align the resistor with the Anode of the LED. The Anode is represented by the bent connector.

Click on a hole across from the resistor. This activates the wire tool and begins a wire connection.
Click a hole in the positive side of the terminal rails. Press the ESC key on your keyboard to release the wire tool.

Click the wire color selector and choose red.

This connects the resistor and LED to the positive terminal.

Connect a wire from the Cathode on the LED to a negative connection on the terminal. Set the wire color, choose black.

Click somewhere along the edge of the breadboard. This selects the breadboard. We need to reduce the size of the breadboard to make room for the Arduino.
TinkerCAD does not have many menu options. We need to use shortcut keys to manipulate some objects. Use the Alt and the minus(-) key on Windows and Chromebook. Mac users, use the Command and the minus(-) key. Use the Alt or Command key in combination with the plus(+) key to increase the size.

Click and drag the border of the breadboard toward the top of the canvas.
The Arduino is just below the breadboard in the components panel.

Place the Arduino below the breadboard on the canvas.
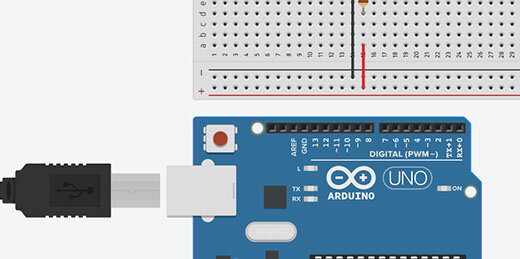
Connect a wire from the Arduino GND GPIO to the negative side of the terminal rail. GPIO stands for General Purpose Input/Output.

Arduino has several types of GPIO connections. The side of the board we are looking at as numbers from zero to thirteen. GPIO pins 0 and 1 are for transmitting text messages. Pins 2 to 13 are used for components.
Some of the numbers have a squiggly line. This is the Tilde character. Numbers without the tilde represent digital pins. We use these pins to turn the LED On or Off. Digital pins provide On or Off options only. These pins provide either zero volts or 5 volts.
Pins with the tilde character provide Pulse Width Modulation. These pins provide varying voltages.
Connect a wire from pin 6 to the positive terminal.

Coding Arduino
Click the code button to reveal the coding panel.
The panel has some code to get us started. This code is used for the built-in LED.

We don’t need this code. Drag the code blocks to the code section.
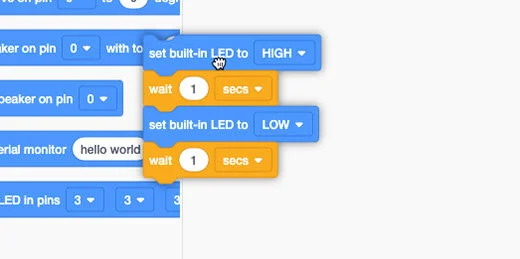
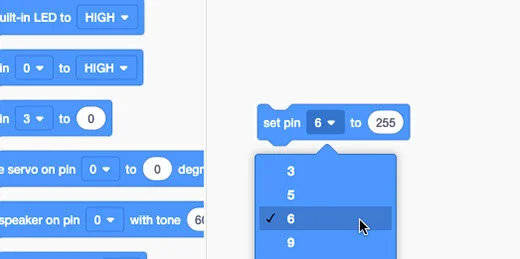
There are two set pin code blocks. One is used with the digital input pins. It has two parameters, high or low. The other set pin code block has a variable parameter. Drag this code block onto the coding area. This is the only code block we need.

Change the PIN number to 6. Change the variable to 255.
Click the Start Simulation button.

The LED should be on.

Click the Stop Simulation button.

Change the variable to 128. Start the simulation.

The available numbers for the variable range from 0 to 255. The total is 256. The value of 128 represents half of 256. The LED will light with half the illumination.
It is hard to tell but the LED is shining with half the brightness.

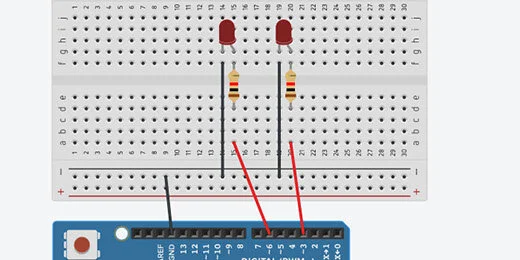
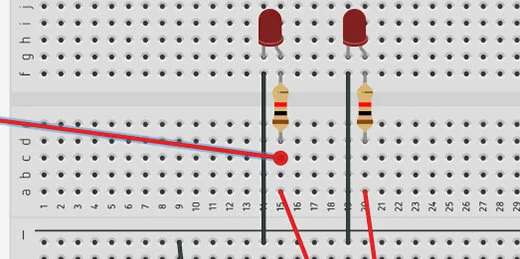
Let’s add another LED to help us with the comparison. Add another LED to the right of the current LED. Add a resistor and make all the same connections. There is one change we need to make. Don’t connect the resistor to the terminal rail.
Each LED needs to be controlled by a separate PIN. Connect the wire from the resistor directly to the GPIO pins on the Arduino. The original LED remains connected to PIN 6. Connect the other LED to PIN 3.
Open the code panel. Add another set pin code block. Place it after the existing code block. Set the pin to 3. Set the value to 255. Start the simulator.

That doesn’t help too much. There is a slight difference.

Stop the simulator. Change the variable for the first LED to 64. Start the simulator.

The difference is a little easier to see.

Pulse Width Modulation
What is pulse width modulation? It turns out that pulse width modulation is a sneaky way to simulate a lower voltage. This is easier to understand by using an oscilloscope. Oscilloscopes display the change in electronic signals over time. The oscilloscope will show us the voltage going through the circuit.
Click the Code button to close the code panel.

Click in the components search box. Type oscilloscope. Select the oscilloscope.

Place the oscilloscope on the left side of the breadboard. Adjust the size of the components so the oscilloscope is visible.

The oscilloscope has connectors. Click the connector on the right to create a wire.

Connect the wire to the resistor before it connects to the LED.
Move the LED up to make room for the next wire.
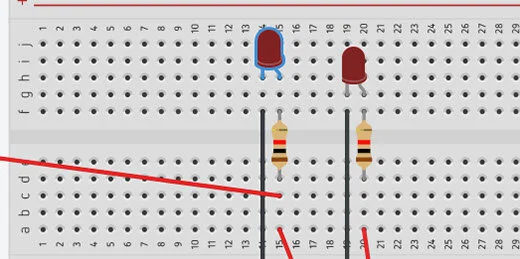
Connect the wire from the negative terminal of the oscilloscope to the cathode of the LED.

Click on the oscilloscope to select it.

Go to the oscilloscope configuration box. Change the measurement from ms(milliseconds) to (us)microseconds.

Change the time per division to 500. These parameters will display the frequencies from the voltage in 500-microsecond increments.

What is a microsecond? Think of a second. That is fast. A second is divisible into smaller time units. The next level of time is in milliseconds. There are one thousand milliseconds in one second. A microsecond is a millionth of a second. One million microseconds make one second. That is very fast.
Electricity travels very fast. Choosing microseconds slows things down so we can see the patterns on the oscilloscope.
Open the code editor. Change the variable to 255.

Start the simulator and look at the oscilloscope. A blue line appears on the oscilloscope. This line represents 4.85 volts.
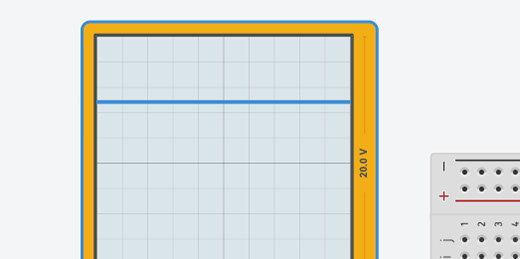
Stop the simulator. Change the variable to 0. Start the simulator. The blue line is in the middle. This represents no voltage going to the LED.

Stop the simulation. Change the parameter to 128. Start the simulator again. The simulator shows lines going up and down.

Let’s take a closer look. When a line appears at the top we know it represents 5-volts. A line at the center represents 0-volts.
This line isn’t flat. The line is at 4.85-volts for a time and then at 0-volts for another time.

The screen has a grid. The vertical lines represent 5ms. The gap between each line is 5ms long.

The oscilloscope shows that the voltage is zero for 5ms and then it is 4.85-volts for another 5ms. This pattern repeats.

Let’s think about what is going on. The voltage changes from 0 to 4.85 very quickly. This is like flipping a light switch on and off very fast. The LED is fully light for 5ms then off for 5ms. It is on half the time. The value we placed in the parameter is 128. This represents half the available voltage going to the LED.
Arduino is flipping the voltage on and off to simulate half the voltage going to the LED.
Stop the simulation. Change the parameter to 64. Start the simulation again. The bars in the simulation at the top are shorter than those at the bottom.

A short bar at the top represents a short time where the voltage is 4.85-volts. A longer bar at the bottom represents the voltage at 0-volts.
How long do you think the voltage is set to zero? The space between the vertical lines is 5ms. The line extends about halfway into the next space. This is roughly 7.5ms. The LED is off for 7.5ms and on for 2.5ms.
The parameter of 64 represents one-quarter of the total voltage. Think of it this way. A value of 128 is half of 256. A value of 64 is half of 128 and a quarter of 256. The LED is on for one-quarter of the time and off for the remainder, three-quarters.
The LED is on for less time and this causes the LED to look dim.
Our human eyes don’t see this pulsing. The pulses are so fast that our eyes take an average of what is going on. We don’t see a blinking LED but a dim LED. This is why we need an oscilloscope. To slow things down.
The voltage is pulsing through the LED. Probably where the name Pulse Width Modulation came from.
Electric circuits and Arduino with TinkerCAD
In the lesson, we create a basic circuit in TinkerCAD. We create a basic LED circuit. We combine the basic circuit with an Arduino microcontroller. We use the microcontroller to turn the LED ON and OFF. We take it one step further and program the LED to blink. A good lesson to learn the fundamentals.

Coding Circuits With Arduino in Tinkercad
An Arduino is a microcontroller. A microcontroller is a very simple computer that accepts basic code. It translates that code into instructions that interact with the physical world. In this lesson, we will use a microcontroller to act as a switch.
Click the link below to see the completed project.
https://www.tinkercad.com/things/3sufhjgf15T
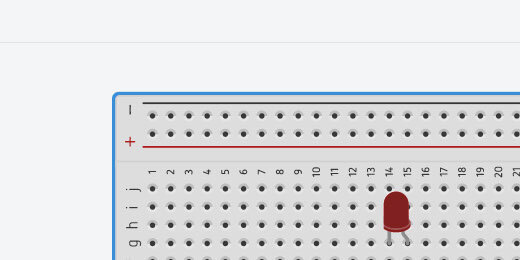
Create a new circuit in TinkerCAD. Add a Breadboard to the work area. Place one LED on the Breadboard and place two jump wires. Connect one jumper wire to the positive rail. Connect the other to the negative rail. Make sure to connect the anode to the positive lead and the cathode to the negative lead. The Anode on the LED is the the one with the bent wire.
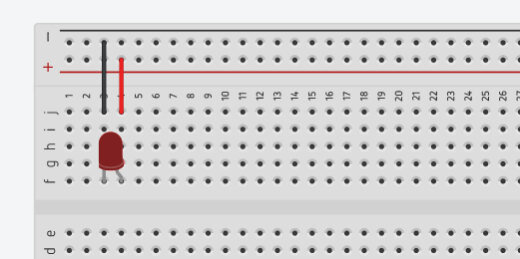
LED on breadboard
Click on the Components button and find the Arduino Uno R3 microcontroller.

Arduino Uno R3 component
Place the microcontroller to the left of the Breadboard. Several components are part of the Arduino board. Let’s look at a couple of these components.
Arduino alongside the breadboard and led circuit.
The holes along both sides of the board are GPIO pins. This stands for General Purpose Input/Output pins. Each is a connector that links to our Breadboard with a jumper wire. Most of these are with a number. These numbers identify the pins in our code. The code we develop on the board can reference these pins as either input or output. There is one connector labeled GND. This is the ground connector or the negative terminal in our circuit. The Arduino provides coded instructions to the components on the board. It also provides the necessary current to make the components work. The GND is the same as the negative terminal on a battery. The other connectors marked with a number are the same as the positive terminal on a battery.
A physical Arduino board connects to a five-volt power supply from a computer USB port. The Arduino itself supplies the same 5 volts to components. For some components, this is too many volts. In our example, the 5 volts will destroy the LED on the Breadboard. We will be adding a resistor to limit the amount of current going to the LED.

GPIO PINs on Arduino
Connect a jumper wire from the GND connector on the Arduino to the negative rail on the breadboard. Take another jumper wire and connect it from the number 3 GPIO to the positive column. I moved the board so you could see the connections. I also color-coded the wires.

Jumper wires from breadboard to Arduino.
This isn’t enough to turn on the LED. We need to do a few more things. Click on the Code Editor button.

Code editor button
A coding panel will open at the bottom of the page. We use blocks to develop code. Like the blocks used in Code.org or Scratch. There is already a program in the editor. This is the standard code included each time we place an Arduino board onto the workspace. This code instructs the LED on the Arduino board to blink. This is not the LED on our Breadboard. The Arduino has a small LED on the board. Click the Start Simulation button to see the LED on the board blink.

LED code block for Arduino.
The blinking LED is on the left side of the Arduino logo. Stop the simulation.
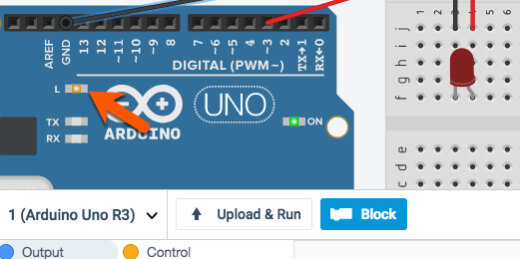
Blinking LED on Arduino board.
We don’t need this code. We want to control the LED on the Breadboard. Click on the first code block and drag it to the trash can icon. This takes everything that is connected to it.

Removing the standard LED code.
We need a little more room to code. Move your mouse pointer to the top edge of the coding panel until you see the arrow change. Click and drag up to expand the coding panel.

Widen the code area.
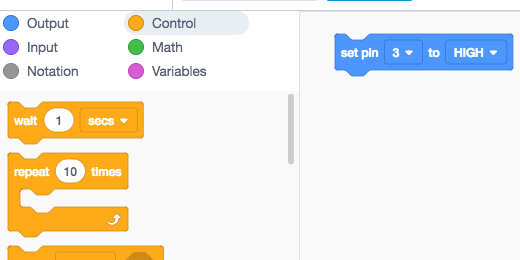
The coding panel has different sections of code. We will be using code blocks in the Output section. Drag the set pin code onto the coding canvas.
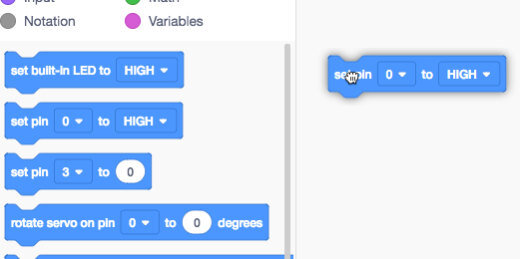
Set pin code block onto canvas.
Most code blocks have options. This code block includes a PIN and a state. The PIN references the connector we used to send current to on the Breadboard. This is the positive jumper wire we connected earlier. We connected the wire to pin 3. The options in the code block are arguments.
The term argument comes from mathematics. The argument of a function is a specific input to the function. It is an independent variable like the pin in our code block. This code block has two arguments.
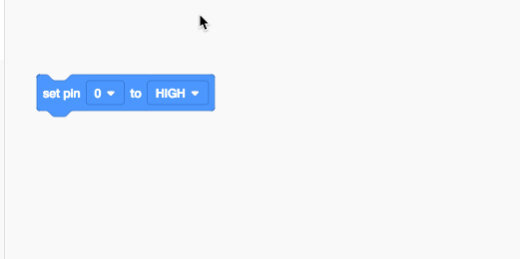
Set pin code and parameters.
Change the pin to 3. The second argument has two states. A state has one of two options. A state can be on or off. The state is set to high. A high state is the same as ON. The other option is a LOW state. This is the same as OFF. Computers read everything as either ON or OFF.
That’s all we need to get started. Click the Start Simulation button. Resize the code block panel to see the LED.

Parameter set to pin 3.
The LED will change color to show that it is on. There is an exclamation mark next to the LED. This exclamation mark is a warning. The current going through the LED is too high. In the simulation, we get a warning. In a physical board with a real LED the LED would burn out and won’t work again. This is why testing or prototyping is useful. LEDs aren’t expensive but expensive enough that you don’t want to be burning them out all the time.
To avoid burning out LEDs we need to use resistors. Resistors restrict the flow of current to components. Every circuit includes voltage, resistance, and current. Current is the part of the equation that does all the work. Think of electric Current like water flowing through a river or stream. Resistance is the width of the river or stream. Narrow streams have more resistance than wide streams.

LED light with warning.
Stop the simulation and close the code editor. We need to make room for the resistor. Move the LED to the other side of the board. Place it in column A.

Changed position of LED on breadboard.
Open the components panel and find the resistor.

Resistor in component panel.
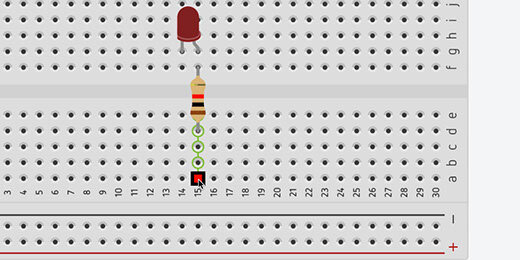
Place the resistor so it bridges the gap between the two halves of the board. Make sure the resistor is in the same row as the anode and the positive jumper wire.

Resistor on breadboard.
The row connections do not span across the board between E and F. Add a jumper wire to complete the circuit.

Jumper wire to complete circuit.
Run the simulation and the LED should light.
Blinking LED
The code we used in the previous example turned the Arduino into a glorified switch. We can do so much more with Arduino.
Click the code editor button to open the coding panel. Click the Control code block category and look for the wait code block.
Wait code block.
Place the wait code block below the set pin code block. The wait argument is set to one second. Leave the argument at this value. Go back to the Output code block category. Place another set pin code block onto the canvas below the wait code block.

Second set pin code below wait block.
Set the pin value to 3 and the state to low. Run the simulation. The LED will turn ON and OFF. The OFF state is too short. Arduino is a very simple computer but it is still very fast. It processes our instructions in fractions of a second. We need to instruct the code to slow things down so we have time to see the changes.

Set pin block with updated parameters
Go to the scripts panel and find a wait code block. Add a wait code block after the last pin code blocks. Leave the wait value at one. Run the simulation again. The LED will turn on and off over and over again. The code we write does not include a loop function but the Arduino repeats the code anyway.

Second wait code block
The code blocks we use are representations of written code. The written code is on the right side. The code has two main sections or functions. The void setup function sets pin 3 as the output pin for the instructions.
The void loop function is where we write the main part of our code. The void loop repeats the code until the simulation stops. On a physical Arduino, we need to turn the power OFF.

The script represented from the code blocks
The void loop instructs the board to set the power to pin 3 to high or On then wait one second. After one second the power to pin 3 is set to low or turned off and then wait one second. The instructions repeat all over again until we stop it by removing power from the Arduino board.
Weather Station Project: Lesson 9
This lesson creates and formats charts with the temperature and humidity information. The charts will display the current day’s temperature and humidity. To do this we will filter our query for sensor readings gathered today.

Line charts
Line charts are used to represent trends in data over time. That describes the information we are collecting. The sensor takes temperature and humidity information at set intervals. That interval is currently every thirty seconds.
We need to select two columns of data. The first will be the time. The second will be the temperature in celsius. We will create charts for Fahrenheit and humidity later.
We don't need to represent all the readings in our chart. For this chart, we will take the first 24 readings. Click on the time heading and drag the mouse down the column to row 25.
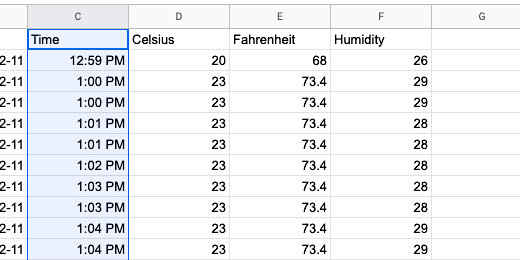
Move the mouse over to the adjacent column and select the corresponding celsius data.

Click Insert on the menu. Go down the list of options and select Chart.

Google will attempt to select a chart type for us. In my example, it chose a bar chart.

A panel opens to the right of the spreadsheet. This panel is used to edit and configure chart settings. Click the Chart type selector. Choose the first line chart option.

The chart isn’t much to look at now. This will change when we modify the sensor reading interval. The temperature readings are on the left.

The chart shows a blue line at the bottom. This represents the time intervals. Go to the panel. Click Use column C as labels.

The time intervals appear on the x-axis.

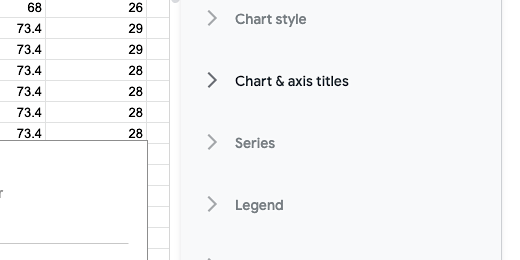
Click the Customize tab in the Chart editor panel.

Click the chevron next to Chart & axis titles.

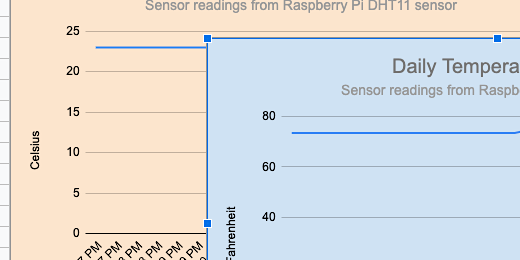
Title the chart, Daily Temperature Data.
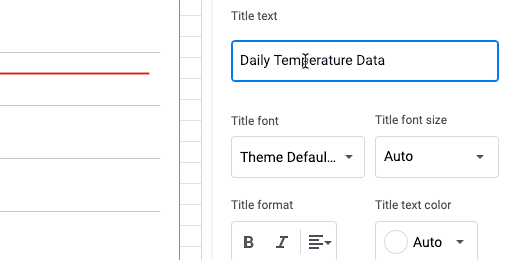
The title appears at the top left on the chart.

Click the text alignment selector and choose center-align.

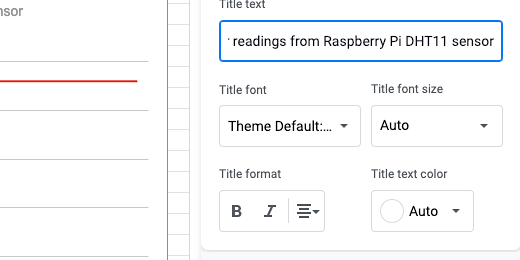
Click the title selector and choose Chart subtitle.

The subtitle is Sensor Readings from Raspberry Pi DHT11 sensor. Change the text alignment to center.
Go to the title selector and choose the Horizontal axis title.

Set the title to Time. Align the text to the left.

Select the Vertical axis title option.

Set the title to celsius.

Click the chevron again to collapse the section.
The tile labels don’t show every time reading. It would be convenient to have all the readings. Open the horizontal axis section.

Click the option to treat the labels as text. The labels are fitted within the horizontal axis.

The data in the chart is from the first day when we began accepting readings. New readings are appended to the end. Today’s sensor readings are at the bottom of the sheet. We need to filter and sort the sensor data.
Today’s Temperature
To display the temperature for the current day we need to filter the data. We do this within the query function.
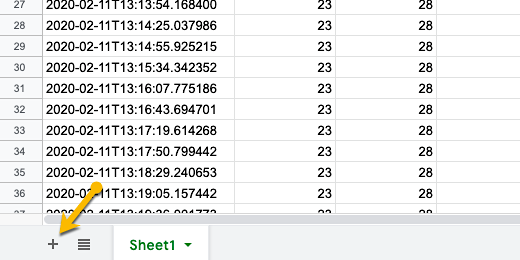
We are going to create a new sheet for this chart. Click the Plus button to create a new sheet.

Double click the sheet name and change the name to Today’s Temp.

Inside of Cell A1, we will query the data. We only need the time and temperature information.
Type =query(‘sensor data’!B1:E,”select *”,1)

The name of the sensor data sheet is in single quotes. This is necessary because there is a space in the sheet name. The data range begins on cell B1. This is where we have the date information. The data in column E contains the temperature information in Fahrenheit. Using the column notation without a number after E selects every cell in columns B,C,D and E. Replace -1 with 1.

To get the readings from today, we need to modify the query. Click on cell A1. We are going to use the Formula Bar to edit the query. Place the cursor after the asterisk.

Add this parameter to the query after the asterisk.
Where B = date ‘“&text(today(),”yyyy-mm-dd”)&”’
This parameter instructs the query to use today’s date as the filter. The filter looks in column B. If there is data for today’s date, then it is listed.
It may look like there are three single quotes after date. It is a single quote followed by a double quote. The order is reversed after the ampersand.

There is a lot of new stuff going on here so I’ll go through the parameters. We are instructing the query to select everything in the columns where the contents of column B match today’s date.
The single quote and quotation marks are like parentheses. The single quotes surround quotation marks and the parameters. The date for today is represented as text in the form of year, month, and date.

Today’s Temperature Chart
We spent some time customizing the chart earlier. We will use this same chart for our new sheet. Go back to the sensor data sheet. Click once on the chart. Click the three dots in the upper right corner. This is called the action menu. Select the option to copy the chart.

Go back to Today's Temp sheet. Click Edit and select paste.

Click the chart action menu and select the Edit chart option.

Click in the Data range field. Erase the data range.

Replace the range with B2:C25.

This chart represents the temperature in celsius. We will use another chart to represent the Fahrenheit temperature information.

Make a copy of the current chart. Click the actions menu and select Copy chart. Click edit in the Google Sheets menu and select paste.

Click the actions menu on the duplicate chart and select Edit Chart.

Erase the data range. The data for this chart spans two separate columns. Those columns are not next to each other. We need to select the columns separately. Type B2:B25,D2:D25. Note that the selections are separated by a comma.

Go to the Customize section of the Chart editor. Open Chart & axis titles. Select the Vertical axis title. Change the title from Celsius to Fahrenheit.
The titles are looking a little bland. This makes it difficult to distinguish. Change the chart color to help identify the charts. Go to the Chart style. Click the background color selector. Choose a light color for the background. A light color will help keep the text on the chart legible.

Repeat the process with the chart with the celsius information.
Humidity Chart
The chart to report the humidity information is similar to the temperature chart. Click the Plus button to create a new sheet. Rename the chart to Today’s Humidity.
Let's take a look at the sensor datasheet. The humidity data is in column F. We will query the data from columns B, C, and F.
Go back to the Humidity sheet and enter this query.
=query(‘sensor data’!B1:F,”select B,C,F”,1)

The select parameter is used to choose the columns of data to display.
We are going to filter the data so only the current day’s humidity information is displayed. We will use the same parameter used for Today’s temperature reading.
Use the Formula bar and place the cursor right after the letter F. Add this parameter.
Where B = date ‘“&text(today(),”yyyy-mm-dd”)&”’

Today’s Humidity Chart
Go to Today's Temp sheet. Choose one of the charts. Click the actions menu and select Copy chart. Return to Today's Humidity sheet and paste the chart. Click the chart action menu and select Edit chart. Erase the current data range. Replace it with B1:C.
Go to the Customize tab in the chart editor. Open the Chart & axis titles. Select the Vertical axis title. Change the title to Percentage.
Select the Chart title. Change the title to Today’s Humidity.
Open the Chart style section. Change the background color.

Weather Station Project: Lesson 8
In this lesson, we explore automation with Google Apps Script. The automation is helpful if we intend to run our weather station project for several weeks. The automation with Google Apps Script will update the formatting of the date information. With automation, we will split the date information and the conversion from Celsius to Fahrenheit.

Formatting with Google Apps Script
Introduction
In the previous lesson, we used the split function to split the date and time information. This function works for all the data up to the last cell in the sheet. The last cell is typically cell 1,000 for new sheets. New date information added beyond this cell doesn't have the function applied. This isn't a problem unless we expect to gather lots of data.
We need to manually copy the function down the new rows if we plan to collect lots of data. That is one way to update the cells. Another way is to do with programmatically. This involves adding a small program to our spreadsheet.
Here is a disclaimer. You don't have to go through this lesson if you plan on having a short run of the weather station. This really all depends on how much data you want to collect. Collecting data every thirty-second is really too much. I would say that collecting sensor information every half-hour to one hour is a little more reasonable.
Collecting data each hour will use up the one-thousand rows in about six weeks. Collecting sensor data every half-hour will fill the rows in half that time. One-thousand rows are therefore good for three to six weeks worth of sensor data. More data requires more rows. Google sheets will automatically add more rows as needed. The split function and temperature conversion are not automatically applied to the corresponding new data.
This happened to me while creating the lessons. I left the code running most of the day and the data went into well over two-thousand rows.
Gathering data from the sensor every 30 seconds is not the best. We will adjust the time interval later. I will keep the code set to 30 seconds for now so we can build the graphing tools.
The formatting needs to be updated as new data is added. To automatically update the function for new rows I want to create an app script. The app script will run at specific intervals.
The script
Google includes a script editor option for most of its applications. The script editor is available in the Tools menu. Open the piweatherData spreadsheet if it isn’t already open. Click Tools and select Script editor.

The code editor opens in a tab to the right of the spreadsheet. The code is created within functions. Google Sheets has one function ready for us to use. App scripts and functions are created in projects. The project is currently untitled.
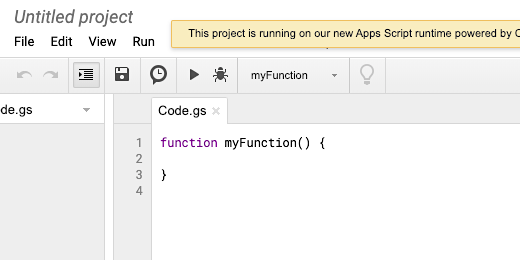
Click the Untitled project name.

Name the project splitDate.

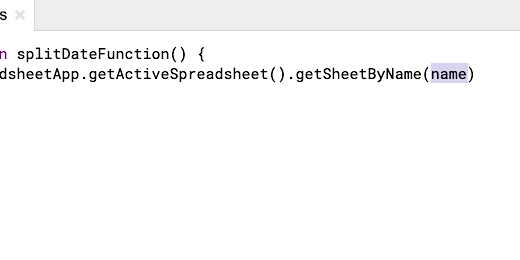
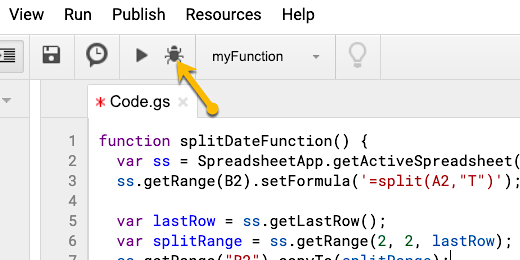
The function of the project is titled myFunction. Change the function name to splitDateFunction.

The code in Google Apps script is case sensitive. The code needs to be typed with the appropriate upper or lower case characters. Errors in the code are often the result of forgetting to properly format the commands. You can copy and paste the commands from my instructions. As always, I encourage you to type out the commands. Doing is learning.
The first command selects the application for the function to use. The application in our lesson is Google Sheets. Our code is created within the opening and closing curly brackets. Click once after the opening curly bracket and press the return key.
Type SpreadsheetApp. Note the upper and lower case letters. This is called a class. We have instructed the function to use the SpreadsheetApp class to call the spreadsheet program.

We begin with a chain of connections to other classes. The first step is to call the spreadsheet application class. The next step is to call the active spreadsheet. The active spreadsheet is the one we are working on. Type a period followed by the word get.

The Apps script editor is helpful. It provides a list of available classes that relate to the spreadsheet app.
We want to get the active spreadsheet. We can continue to type the command or use the down arrow key on the keyboard to select the class we need. Continue typing getActiveSpreadsheet. The getActiveSpreadsheet class is the only one that is left. Press the Return key to finish selecting the class.

We want to get a specific sheet in our spreadsheet. The sheet with the date information is on the sheet named sensor data. Type a period followed by the word getSheet. We want to get the sheet by its name. Make sure getSheetByName is highlighted and press the Return key.

The name of the sheet we want to use needs to be placed within the parenthesis.
Type ‘sensor data’ within the parenthesis. Include the single quotations around the sheet name.

We are going to end this part of the code here. Type a semicolon at the end of the code. The purpose of this line is to select the sheet we want to use.

Return to the beginning of the line. Type var ss = at the beginning. This creates a variable called ss. The active spreadsheet and sheet information are placed in the variable ss.

Go to the line below this code. We are going to use the variable we created to perform the next step.
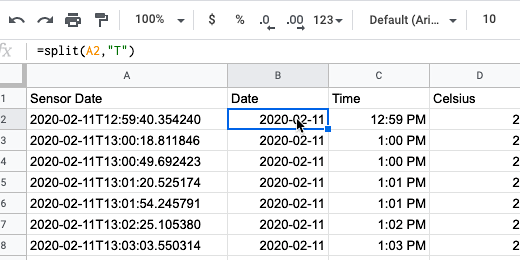
Take a look at the spreadsheet and the sensor datasheet. We want to set the split function in the first cell. The first cell for the split function is B2. The function is already here. The goal is to replace the function in the cell with the code we are creating.
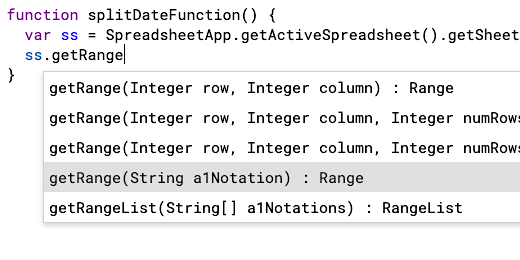
Type ss.getRange. The ss variable is used to get the range in the sensor datasheet. There are several Range options.
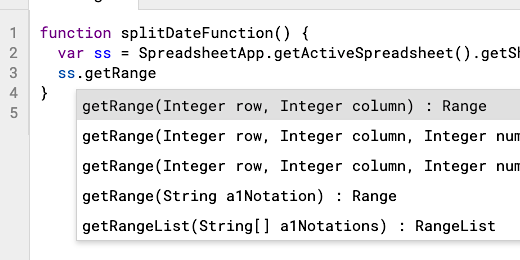
We want the range that gets a range using string notation. String notation is used when referencing a cell with a letter and number. Use the down arrow key and highlight getRange(String a1Notation). Press the Return key.
Replace the notation within the parenthesis with B2.

Type a period followed by setFormula. Use the class setFormula(String formula).

The spit function goes inside the parenthesis. Type (‘=split(A2,”T”)’).

Finish this line of code with a semicolon. Press the Return key to add another line.
We want to determine the last row with data. There is a class to do this for us. We are going to store this information in a variable.
Type var lastRow = ss.getLastRow();
This gets the last row with data in the data sensor sheet. The location is stored in the variable lastRow.

Press the Return key for the next line of code. We need another variable for the cell range from the first cell to the last. This Range information will be used to place the split function into each cell in the range.
Type var splitRange = ss.getRange. There are several Range options. We want the second option.

We need to identify the starting row and column for the first two parameters. The third parameter is for the number of rows to select.

Go to the piweatherData spreadsheet. The function to split the date and time is in the second row and second column.

Place the number 2 for the row and column parameters.

The parameter for the number of rows references the total number of rows with data. We have this value in the variable lastRow. Replace numRows with lastRow. Finish the line with a semicolon.

Press the Return key for a new line. Type ss.getRange(“B2”).copyTo(splitRange);.
The variable splitRange contains the cells beginning at cell B2 and ending with the last row with data. The Range information is something like B2..B1036. In this example, B1036 is the last row with data.
This line gets the function we placed in cell B2 and copies it down the column to the last row with data.

The code is done. All we need to do now is run it. Before running the code we are going to check and make sure there are no errors. Make sure all the lines end with a semicolon. Check the spelling of all the commands and variables. Commands and variables are in different colors. The colors will give you a hint if there is something wrong.
The editor has a program checker. It is called the debugger. The button has a bug for an icon. Click the debugger icon.
The debugger needs to run the code. Google needs your permission. Click the Review Permissions button.

Click the account used for the spreadsheet and script. A message appears informing you that the app isn’t verified with Google yet. Click the advanced link.

It references the name of the function that will run. Click the Go to splitDate link.

Click the allow button so the function we created can access the spreadsheet in Google Drive. No error messages will appear if everything goes well. If there are error messages you will need to check the code for mistakes. Run the debugger until you find all the mistakes. Check the cell references in the function.
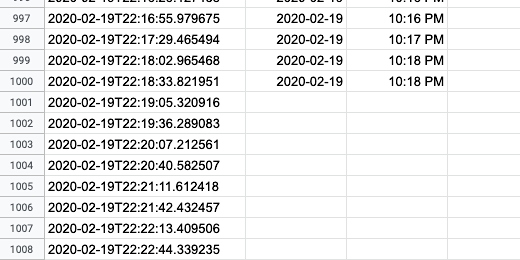
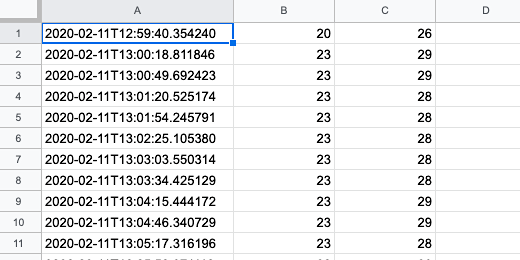
Here is my sensor datasheet. The date and time information is split up until the 1000th row.
Click the Play button in the script editor button bar.

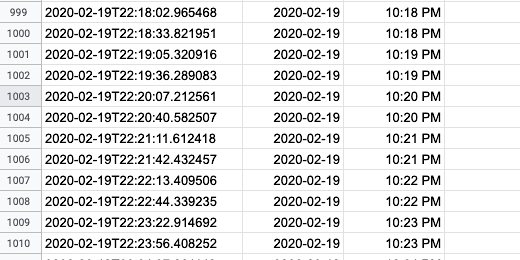
The date and time information is split down the column until the last row with date information.
Update Fahrenheit conversion
Our Fahrenheit conversion is suffering from the same problem. The last conversion took place on the 1000th row. We need to automate the conversion here too.
Coding might be a challenge to learn at first but it makes the creation of tasks easier. In this example, we don’t need to write a new script to handle the Fahrenheit conversion. We will use the same function and adjust it to fit our needs.
Return to the code editor. Highlight the function from the word function to the last closing bracket.

The code in my editor works fine but isn’t formatted properly. The function name is indented a couple of spaces. The rest of the code is out-dented within the function. It should be the other way around. Press the Tab key while the code is highlighted. This instructs the editor to format the code. The code within the function is indented within the function. Yup, another teachable moment.

Keep the code highlighted and copy the code. The menu doesn’t have a copy option. You will need to use the keyboard commands Control+C or Command+C. Click once after the last closing bracket. Press the Return key twice. Past the code. Press Control+V or Command+V to paste.

We have two functions that do the same thing. Change the function name from splitDate to fahrenheitConvert.

The Fahrenheit conversion is in the same sensor datasheet. We don't need to change this line of our code. The conversion formula is in cell E2. We need to change the getRange parameter to E2.

Change the formula in the setFormula parameter to =D2*9/5+32. Change the single quotes to double-quotes.

The formula is in the second row and fifth column. Change the column parameter in the splitRange variable to five.

Change the getRange parameter in the last line from B2 to E2. Click the save button.

We have two functions now. We need to select the new function before running it on the sheet. Select the fahrenheitConvert function.

Click the Play button. The conversion formula is copied to the remainder of the cells. We didn’t run the debugger here because the changes we made won’t be caught by the debugger.
Triggers
The process is semi-automated. The code will update the formulas in the cells. This still requires that we open the spreadsheet, open the code editor, and press the play button. The goal is to completely automate the process so the formulas are updated on a regular basis.
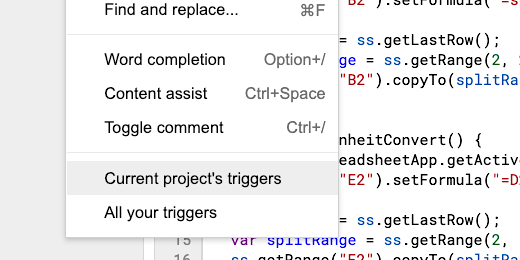
Google has an automation process called triggers. This is similar to a process we will use in a future lesson to schedule the Python script. Click Edit in the code editor. Select "Current project's triggers".
A tab is opened to the right of the code editor. This tab is opened to the Google Apps Scripts triggers portal. We are going to create a trigger to schedule the functions.

Click the Add Trigger button. It is found in the lower right corner of the page.

A trigger configuration panel opens. The triggers are linked to our Google account. Any function created under the account is available as a trigger. The splitDate function is selected.

Click the selector to reveal the other function. Leave the splitDate function selected.
Go to the Select event source option. Click the selector and choose Time-driven.

The options update with selectors for the time-based trigger.
A thousand rows will hold data for 42 days when we update the data every hour. This is enough for about six weeks. I have done some rounding in my math. It is actually 41.66 days.
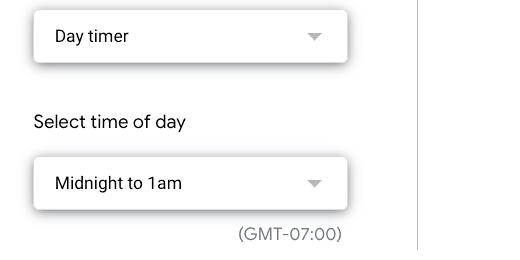
There are several trigger options. I don't want to schedule it too often. I don't want to schedule it where days go by without an update either. If I schedule it on a weekly basis the extra decimal place will eventually catch up with me. This is why I am choosing the daytimer option.
The daytimer option includes a time of day selector. The time is set to between midnight and 1 am every day. This is fine.
There is one more option. This option is a notification. The trigger will send me an email confirmation. Leave this notification option alone. Click the Save button.
The trigger portal is updated with the trigger we created.

We have two functions to run in our sheet. We need another trigger to run the Fahrenheit conversion function. Click the Add trigger button. Select the fahrenheitConvert function.
Set the trigger to be time-driven. Set the trigger to run on a daily basis. Click the save button.
The trigger’s page updates with our second trigger.

The triggers are set and we don’t have to worry about running the functions manually.
Modified functions and trigger
We have two triggers running on the same spreadsheet. These triggers are set to run on the same days and time. This is not the most efficient way to do this. Ideally, we should have one trigger for both functions if they are going to take place on the same date and time.
Return to the code editor. Click after the last line and press the Return key twice.
We are going to create a function that runs the other functions. This is one of the purposes of functions. Type function updateFormulas(){ and press the Return key twice. Place a closing curly bracket on the second return.

Type this between the curly brackets. Type splitDate(); and press the Return key. Type fahrenheitConvert();. Click the save button.

Return to the triggers tab. We don't need both triggers now. Hover over the first trigger. There is an action menu on the right. Click the menu and select Delete trigger.

Click the Delete Forever confirmation.
Hover the mouse over the remaining trigger. Click the pencil icon to edit the trigger.

Click the function selector. Choose the updateFormulas function. Leave everything else the same and save the changes.
Cancel the edit and refresh the triggers page if you don’t see the function appear in the list.
We have one trigger that runs both functions.

That ends our exploration of Google Apps scripts and Triggers. The next lesson jumps into the charts and gauges for our data.
Weather Station Project: Lesson 7
Before we organize the data we need to attend to some formatting. The date and time recorded in the spreadsheet look a little confusing. We will format the date and time information. Google sheets have functions to split the information into cells. We are going to use this function to split the date information into date and time columns.

Introduction
The Python script is getting data from the sensor. This data is being sent to a Google sheet. In this lesson, we will organize the data. The data will be used to generate temperature charts.
Before we organize the data we need to attend to some formatting. The date and time recorded in the spreadsheet look a little confusing. We will format the date and time information. Google sheets have functions to split the information into cells. We are going to use this function to split the date information into date and time columns.
The python script is sending the temperature information in degrees Celsius. We will convert Celsius to Fahrenheit. The temperature will be represented in both formats in our published charts. The data will be represented using line charts and gauges. That is the subject of the next lesson.
Formatting date and time
The date and time information in the spreadsheet is sent by the Python code in isoformat. The date and time information in one cell. We are going to separate this information. The data is missing headings.
We will add headings to help identify the date, time, temperature, and humidity.
The data in our spreadsheet is live. I don’t like to interfere with a sheet that is collecting data. We will create another sheet in the same spreadsheet. This sheet will be used to format and organize the data.
The sheet name used for our live data is Sheet1. There is a plus button on the far left where we see the sheet name. Click the plus to create another sheet.
The new sheet is created and placed to the right of the current sheet. The sheet is titled Sheet2. We are going to rename the sheet. Click the triangle next to the sheet name.

Click the rename option.

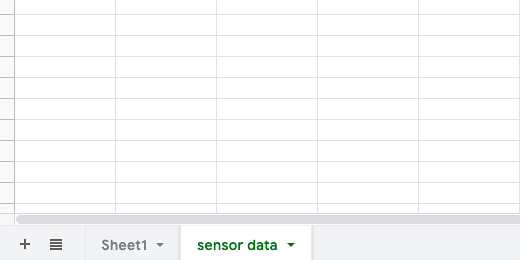
Change the name to sensor data.
Click once on cell A1. Type Sensor Date.

Click on cell B1 and type Date. Click on cell C1 and type Time.

Click on cell A2. We are going to import the sensor date and time information from Sheet1. We are going to use a function called a Query. To use a function we use the equal sign. Type the equal sign followed by the word query.

We need to provide some basic information in the query. The information provided in the query is the query parameters. We need to identify the location of the data to query. Parameters are enclosed in parenthesis. Type an opening parentheses.
Google Sheets supplies a helpful information box that identifies the three basic parameters.

The information is in Sheet1. Type Sheet1 followed by an exclamation mark. For example, =query(Sheet1!,. This parameter is case sensitive. Make sure you begin with a capital letter S.

The data begins in the first column and row. Type the cell location. The cell location is A1. All of the information we need is in the first column. Type a semicolon followed by the letter A. We have selected the range for our query. Finish the selection by typing a comma after the letter A. This is what the query should look like now, =query(Sheet1!A1:A,.
The parameter begins with cell A1 and selects everything in column A.

The second parameter instructs the query of what information to use in the range. There is only one column of data in our range. We still need to identify what to select. Type "select *" followed by a comma. This instructs the query to select everything in the range A1:A. The asterisk is used to identify everything. It is referred to as a wildcard in searches. The comma identifies the end of this parameter.

The last parameter identifies if the data has a header. A header is a title at the top of the column. Our column does not have a header. Type a -1 and finish the query with a closing parenthesis. If the data had a header the value would be the number 1 without the minus sign. Press the return key to run the query.

Splitting date and time
The date and time information flows in from Sheet1. This information is continuously updated from Sheet1.

The date and time information spills over into column B. Move the mouse between the column A and B headers. Click and drag to the right when the pointer changes to an arrow pointing to the right.

Make sure column B is clear. Click on cell B2. We are going to use another function to split the date and time information. Type the equal sign followed by the function name split.
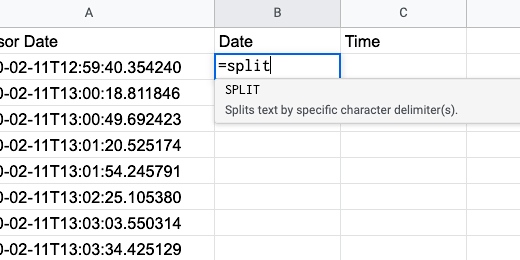
The split function needs parameters. Type an opening parenthesis. The first parameter identifies the location of the content to be split.

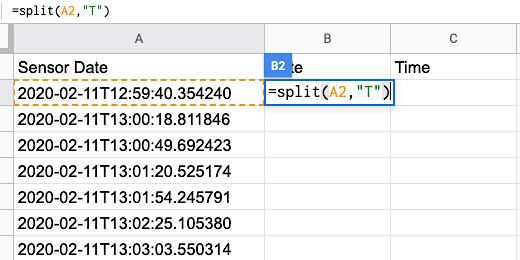
Type A2 followed by a comma. You will see that cell A2 is surrounded by an orange marque.

The second parameter identifies a delimiter. A delimiter is a character like a comma or a tab. The date and time information is separated by a letter. This is the letter T. The letter will be our delimiter. Type the letter T between quotation marks. Finish with a closing parenthesis. Press the return key.
It is rare to have a delimiter like T. Most delimiters are commas, tabs, spaces, or semicolons.
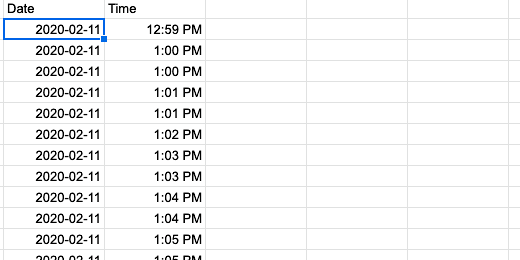
The date appears under the date column. The time is split over to the Time column.

Formatting date and time
The date information is formatted with the year first. This is followed by the month and date. The time includes the hour, minutes, and seconds. I think that the hour and the minutes are fine. We don't need seconds.
Click on cell C2. Click Format. Go down the list of options in the secondary menu. The available time format includes seconds. We need to create our own formatting to exclude seconds.

Move the cursor all the way down to the last item. The last item, More Formats, has an additional menu option. Select More date and time formats.
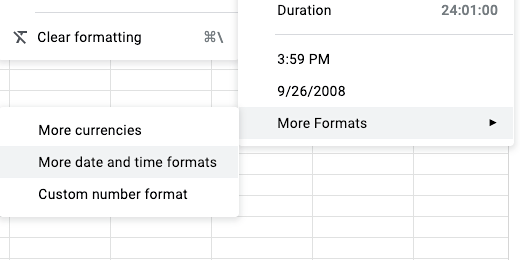
Find the format that has the hour and minute followed by a PM. Click on this option and then the Apply button.

We need to copy what we just did to the rest of the cells in the columns. Click on cell B2. The selected cell is surrounded by a blue outline. There is a tiny square in the lower right corner. Move the mouse pointer over the square until the pointer changes to a plus symbol. Double click the square when the cursor changes.

The date and time are copied down the columns.
The function is copied all the way down. An error appears after the last row. This is fine. The errors are resolved as new date information appears in column A.

The time formatting isn’t copied. We are going to select the entire column and then apply the formatting. Click once on the column C header. The header turns grey and the cells in the column are all highlighted.

Click Format on the menu. Go down the list of format items. The menu keeps track of the latest formats applied. Select the time format we used earlier.

Temperature conversion
We are going to query the temperature information in the next column. Type Celsius for the column title.

The query is identical to the query we used to import the date information. The data is in column B of the sensor datasheet. Go to cell D2 and type =query(Sheet1!B1:B,"select *",-1).

There are various units of measure to represent temperature. The two most common are Celsius and Fahrenheit. The data from the sensor is represented in degrees Celsius. We will convert this temperature to Fahrenheit.
Fahrenheit was proposed in 1724 by Daniel Gabriel Fahrenheit. The temperature is represented by the degree symbol followed by the capital letter F. Zero degrees in Fahrenheit is the point where a solution of water and salt freezes. This solution is called brine. Removing the brine from the water raises the temperature at which water freezes. Water without brine melts at 32-degrees Fahrenheit. The boiling point of water is 212-degrees Fahrenheit. The difference between the freezing and boiling temperature is 180-degrees. This information is important in our conversion.
Celsius is named after the astronomer Andres Celsius. Celsius measures zero where water freezes. The boiling point of water is 100-degrees celsius. Celsius is used when measuring temperature all over the world. The United States is the only country to still use Fahrenheit. This is why we are converting the temperature.
Understanding how the temperature scales were developed is key to understanding how to convert Celsius to Fahrenheit. To calculate Fahrenheit from celsius we multiply by 9 and divide by 5. We then add 32.
Here is how the formula came about. We add 32 because water melts at 32 degrees Fahrenheit. In Celsius, the temperature of water freezing is set to zero. Water freezes the same way. Each unit chooses to represent the freezing temperature of water at different units.
Why do we multiply by 9 and divide by 5? The scales don't rise and fall at the same rate. The difference is due to the different freezing and boiling points. The boiling point of water on the Fahrenheit scale is 212-degrees. The boiling point on the celsius scale is 100-degrees.
We actually multiply by 180 and divide by 100. These are large numbers to multiply. The degrees are a ratio. Ratios are expressed as fractions. The fraction in this equation is 180/100. We reduce the fraction to 9/5. This is an easier fraction for multiplication and division.
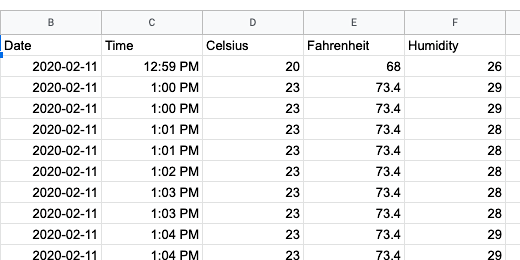
Here is an example. A temperature reading from the sensor is 20-degrees celsius. Multiply 20 by 9. Divide the product by 5 and add 32. The temperature in degrees Fahrenheit is 68.
Type Fahrenheit for the title in cell E1. Go to cell E2 to enter the formula. Formulas begin with an equal sign. Just like functions. Type the equal sign followed by D2. This references the value in cell D2. A number appears above the cell. This is giving us live feedback on our equation.

The multiplication symbol is usually represented by the letter x or a dot •. We don’t use these symbols in spreadsheets or coding. The asterisk, * is used for multiplication. Type an asterisk followed by the number 9.

The division symbol is /, a forward slash. Type the forward-slash followed by number 5.

Type the plus sign followed by the number 32. The preview of our equation’s answer is 68. This agrees with the example we used earlier. Press the Return key.

Click on the cell with the equation we created. Double click the square in the lower right corner to copy the equation to the rest of the cells in the column.

Humidity
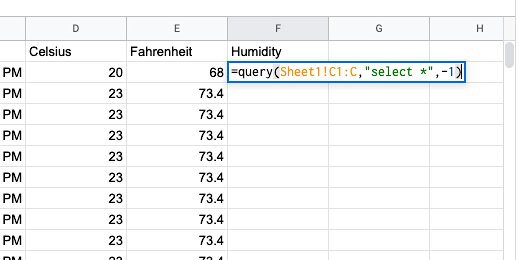
We are going to query the humidity information into the next column. Type Humidity for the title in cell F1. Use this query to bring in the humidity data. =query(Sheet1!C1:C,”select *”,-1)
The data is ready to create the charts.

Weather Station Project: Lesson 6
I cover the process for transferring the file to the Pi using Mac and Windows. The transfer on these operating systems is done through the command line. Chromebook doesn’t a similar command for its command line. We will use our GitHub account to download the file onto the Pi.
There is a sample script that is part of the DHT package we downloaded in a previous lesson. We will modify this file to send the sensor data to the Google Sheet.

Introduction
We need the JSON file from the previous lesson. This fill will be transferred to the Pi. It will be used by our Python script to send the sensor data to the Google Sheet.
I cover the process for transferring the file to the Pi using Mac and Windows. The transfer on these operating systems is done through the command line. Chromebook doesn’t a similar command for its command line. We will use our GitHub account to download the file onto the Pi.
There is a sample script that is part of the DHT package we downloaded in a previous lesson. We will modify this file to send the sensor data to the Google Sheet.
JSON file
In the previous lesson, we downloaded the JSON file for our Google Sheets API. You should have placed the file into a folder titled 'weatherFile'. This file needs to be copied to the Raspberry Pi.
We are using the terminal to transfer the file with a protocol called Secure Copy, scp.
Open a terminal window. Don't log in with SSH. In the terminal, we have access to navigate the contents of our computer. I will go over the process using MacOS first.
Mac SCP file transfer
The commands on MacOS are very similar to those on the Raspberry Pi. Open the terminal application. Type ls -l to see what folder you are in.

The content listed should be those of your home folder or directory. The home directory contains the Desktop folder.

If you don't see the Desktop folder then you are probably not in your home directory. Type cd ~ and press the Return key. The tilde character instructs the terminal to switch to the home directory.
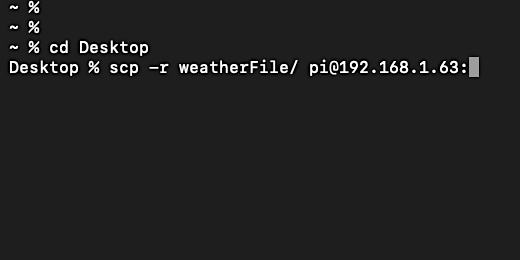
Type cd Desktop to move into the desktop directory. The folder with the JSON file should be in your Desktop folder. Type scp -r weatherFile/ pi@192.168.1.63:. Replace the IP address with the one for your Raspberry Pi. Make sure to include the colon after the IP address. The colon instructs SCP to get the directory from the current location.
Provide the password for the Pi account. The folder and file within will be transferred to the home directory of your pi account.

You will get a confirmation that the file was transferred.

Windows CP file transfer
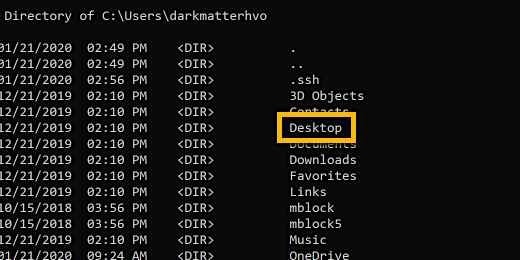
Open the Windows command prompt. Here is a hint if you don't remember. Type cmd in the search box. Type dir to get a listing of the files and directories in your home directory.

There are several files and directories. We need to access the desktop directory. This is where we saved the JSON file inside a folder. Type cd Desktop and press the return key.
Type dir to get a listing of the desktop contents. The folder with the JSON file is in the weatherFile directory. We will copy the directory and file over to the Pi.
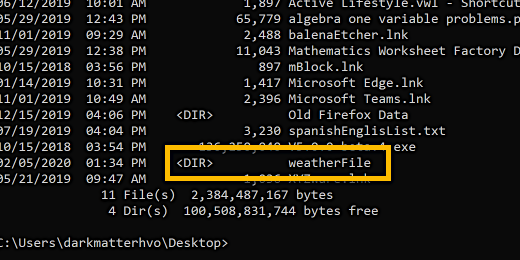
Type scp -r weatherFile/ pi@192.168.1.63:.

Enter the password for the Raspberry Pi.

The command prompt returns with information for the JSON file in the folder. This confirms the file and folder transfer is complete.
Chromebook file transfer
Chromebook don't have a way to transfer the file over to the Raspberry Pi like Mac and Windows. Well, that isn't entirely true. The latest Chromebook with access to Google Play has access to apps and extensions. Not all teachers and students have access to the latest products. I don't want to leave them out. So I have come up with an alternative.
We created a Github account in an earlier lesson. We used the account to download the sensor libraries and examples. We are going to upload our JSON file to Github from the Chromebook. We will then log into the Pi and download the file from Github.
Open the Chrome browser. Go to https://github.com and log into your account. We are going to create a repository to store our JSON file. Click the New button.

We need to provide a name for the repository. The repository name is the same as a directory or folder. This repository is tied to the account name for your Github account.

Name the repository weatherProject. Don't use spaces in the name.

Provide a description for this repository. It isn't required. It is always a good idea to document your repositories. Repositories are usually a way to share your projects with the community. In this case, we don't want anyone to have access to your JSON file. Select the option to make this repository private.

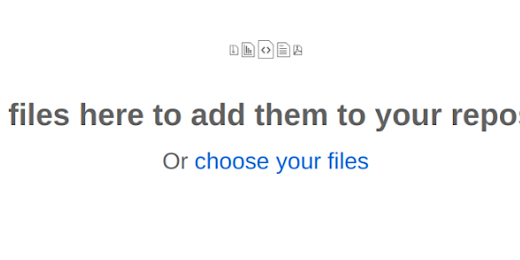
This is where we upload our JSON file. Click the link that reads uploading an existing file.

Click the choose your files link.
Open the weatherFile folder if you placed the file inside.

Select the weatherStaion JSON file and click the Open button.

The file is small. It doesn't take long to upload.

Click the Commit changes button.
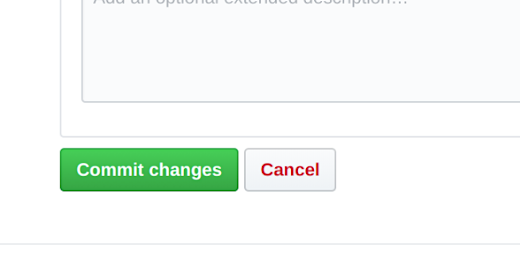
The JSON file will appear in your weatherProject repository.

The repository is part of the web link in the browser address bar. This information is the path to the repository. Write this path down somewhere. You will need it soon.

When downloading a repository we see the same path.

In the next step, we are going to log into the Raspberry Pi. Click the SSH extension and select your Pi connection.

Enter the password for your Pi account.

Type git clone followed by the link to your repository. The link begins with https://github.com. This is followed by your account name and the repository name. Press the return key.

Enter the username for your Github account. We are prompted for the username because the repository is private. We need to log in to access the file. You are prompted to enter the account password after entering the account name.

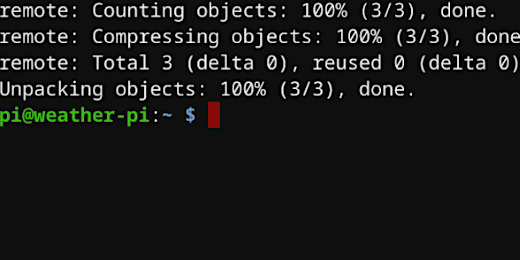
The file downloads and the command prompt returns.
Type ls to verify the repository is in the home directory.

The file is in a directory with the same name as the repository. We need to change the name to weatherFile. Type mv weatherProject weatherFile.

The mv command is the move command. This is how we rename files and directories in Linux. The directory is moved and named weatherFile. The old directory is removed.
Get a list of the directory. Confirm the directory name has changed.

Weather File Directory
There are two directories in our home directory. We are going to create another directory to hold our project files. Type sudo mkdir weatherScript The mkdir command creates a directory.

We are going to copy the JSON file into this folder. Type sudo cp weatherFile/. We only need the file inside the directory. We don't remember the full name of the file but this is where Linux is helpful.

The file begins with the word weather. Add the word weather to the command. Example, cp weatherFile/weather. Press the tab key on your keyboard once.

Linux looks at files in the directory that begin with the word weather. If there is only one file then it completes the name of the file for us.

Complete the command by typing weatherScript/. Example, cp weatherFile/weatherStation-33f21afa3c11 weatherScript/.

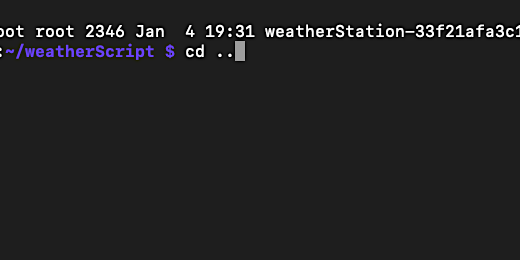
We don't get a confirmation. Type cd weatherScript/. Type ls -l to confirm the file is in the directory.

Now we are going to work on the script to upload our data to the Google Sheet.
Google sensor script
The DHT library includes a simple test script. We used the script to verify the sensor is working. There is another example file in the directory with a sample script for uploading our data to Google. Type cd .. to return to the previous directory. The two dots refer to the directory above the current directory.
Type cd followed by the letters Ad. Press the tab key to complete the rest of the directory name.
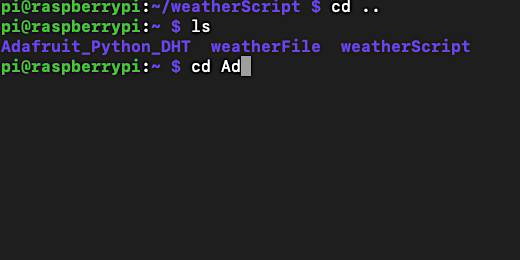
Press the Return key to move into the directory.
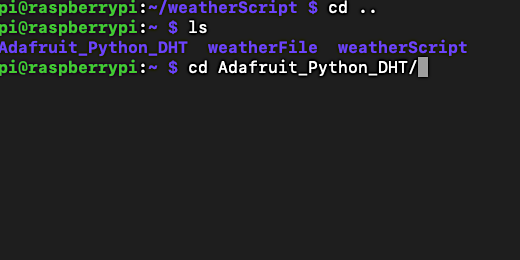
Type ls -l to view the files in the directory.

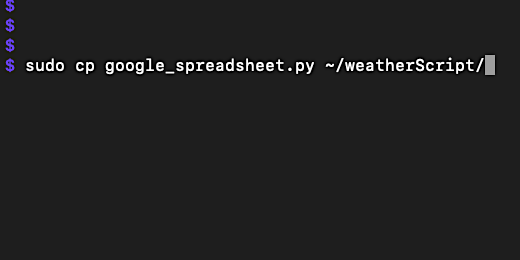
The sample file is in the examples directory. Type cd examples/ and then ls -l. The file we need is google-spreadsheet.py.

We are going to copy this file to our script directory. Type sudo cp google_spreadsheet.py ~/weatherScript/. This instructs Linux to return to the home directory and copy the file into the 'weatherScript' directory.
Type cd ~/weatherScript/ so we can begin working on the script. Get a list of the files in the directory. Write down the name of the JSON file. You will need to provide this name later.
Script Google authentication
The Google script includes the lines of code we need to publish our data. Type sudo nano google, and press the tab key to complete the file name. Press enter to begin editing the file.

Use the down arrow to get to the import section. This is where we see all the hard work pay off. The import section imports all the libraries that are needed to communicate with the DHT sensor and Google Sheets. Some of the import names should look familiar, Adafruit_DHT, gspread, and the oauth2client.

Move the cursor down to the DHT type line. Move the cursor to the end of the line. Change the sensor type from DHT22 to DHT11.

The pin connection for the DHT sensor is already at 23. We don't need to change that pin value.

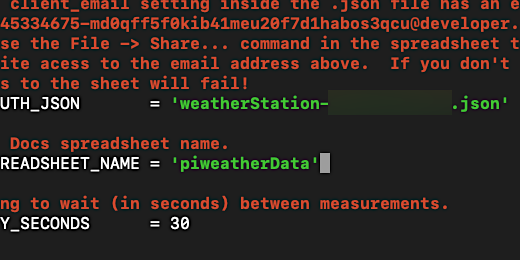
Move the cursor down to the GDOCS line. We need to provide the name of the JSON file. We also need to provide the name of the Google Spreadsheet. This is where you are going to need to manually enter the complete name of the JSON file.
Move the cursor with the arrow keys to the dot of .json. Press the backspace or delete key to erase the example information. Type the name of your JSON file.
Type the Google spreadsheet name in the corresponding line.

The JSON file name begins with weatherStation. A hyphen and series of numbers and letters come after the name. Make sure to include the '.json' extension. This is important. The Google Sheet name is piweatherData. That is all the information we need to provide. Let's take a look at the code and learn what is going to happen.
The code
The code will fetch data from the sensor at thirty-second intervals.

The information from the JSON file and the spreadsheet name is used to access the Google Sheet. The "Try" section of the code tries to connect to the Google Sheet with the authentication information. This authentication information is in the JSON file. If there is no success we will get a message. That is where the "except" section returns the unable to connect message.

The code will try to get the data from the sensor. If it does not receive data it will wait for two-seconds to elapse and try again.
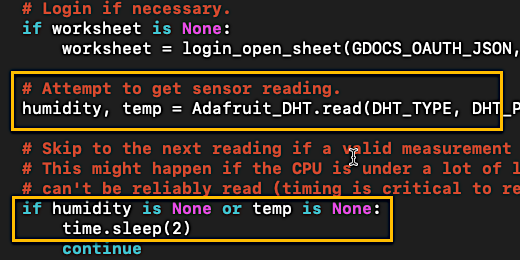
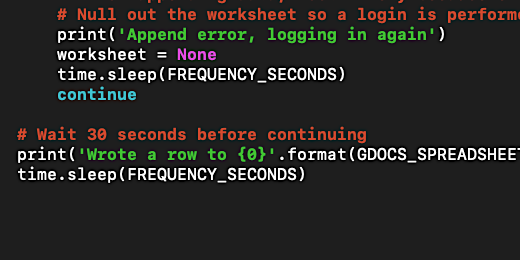
If the sensor sends data to the program then the program will try to submit the information to the Google Sheet. It will append the data to the sheet by adding it to the first row. If it can't access the Google sheet it will wait and try again. If it can't access it at all, then it will report an error.

At the end of the loop, the script will announce that it published the sensor data to the Google Spreadsheet. It will wait for thirty-seconds and repeat the process. It will do this until we stop the program. The program is terminated by pressing the keyboard combination Control+X.
We need to save the file and exit nano before running the code. Press Control plus the letter 'o' to write the changes to the file. We are prompted to confirm the file name. Press the Return key to confirm. Press Control + x to exit the nano editor.

To run the script type sudo python3 google_spreadsheet.py.
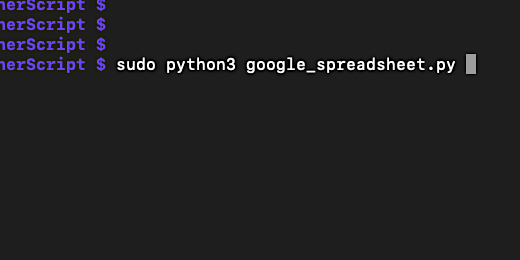
The sensor will send data. We will get confirmation on the terminal too.

Go to Google Sheets and open the spreadsheet. The Google Sheet is accepting data from the python script. Let the script run a few minutes.

The data will remain in the spreadsheet after we have stopped the Python script. Logging out of the Raspberry Pi SSH session will also terminate the script. Keeping the script going is part of a future lesson. Stay tuned.
Weather Station Project: Lesson 5
In this fifth lesson, we will create a Google account. The account is necessary to create and enable the APIs for our project. An Application Program Interface provides a way for us to access Google services. We need access to our Google Sheets account. We also need access to Google Drive. The access permits the Python program on our Pi to send information to a Google Sheet. Google provides a special file. This file is used by our script to access the Google Sheet for our project.

Introduction
In this fifth lesson, we will create a Google account. The account is necessary to create and enable the APIs for our project. An Application Program Interface provides a way for us to access Google services. We need access to our Google Sheets account. We also need access to Google Drive. The access permits the Python program on our Pi to send information to a Google Sheet. Google provides a special file. This file is used by our script to access the Google Sheet for our project.
Google account and API
In the previous lesson, we connected the sensor to the Raspberry Pi. The Pi is collecting temperature and humidity information from the sensor. The sensor is queried every thirty-second. This information is displayed on the terminal window.
The data collected from the sensor is temporary. We need a way to collect, store, and share the information.
Google Sheets provides an easy way to share data with the world. Google has services called APIs. An API is an Application Program Interface. It provides a way to gather information from an application like Python. It shares the information with Google applications. That application is Google Sheets in our project.
The API services are free to anyone with a Google account. We need to enable and configure the services before using them. The first step is to create a Google account if you don't have one. Go over to https://accounts.google.com/signup to create an account. Log into the account.
We need to enable and set up our Google API. The API will provide the information we need in our Python code. Go over to https://console.developers.google.com. A welcome message will appear on your first visit to the developer's console. Agree to the terms and conditions and continue.

We need to create a project. Click the Project selector.

A box will open so we can select a project. Click the New Project button.

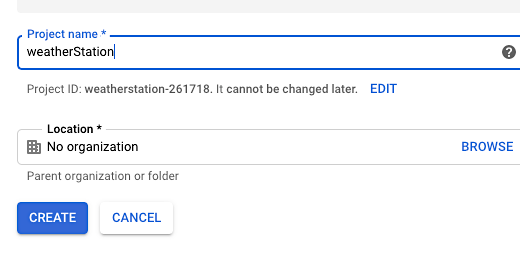
A new project page opens and suggests a name for the project.
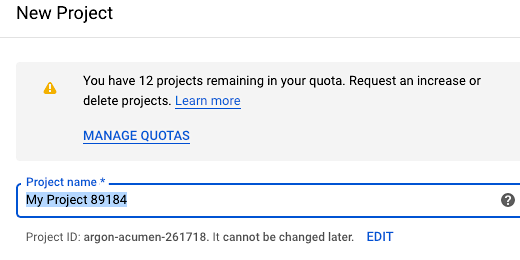
Erase the suggested name and type weatherStation. I don't include spaces in the name on purpose. The project will eliminate the spaces for us. I like to choose how the name will appear when created.
The first letter of the first word is lower-case. The second letter of the second word is upper-case. This is a format for creating names in coding. The format is often referred to as Camel Case. Click the Create button. Don't worry about the organization's information.
The project page opens after clicking the create button. We need to enable APIS and Services. Click the button to enable these services.
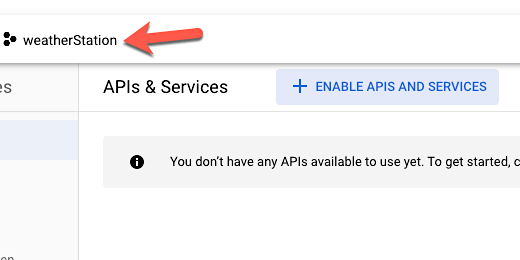
An API library page opens.

Scroll down the page. Look for the Google Sheets API tile. Click the tile.
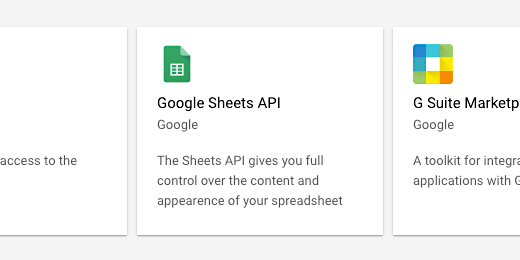
Click the Enable button.

The Google Sheets API is now enabled.

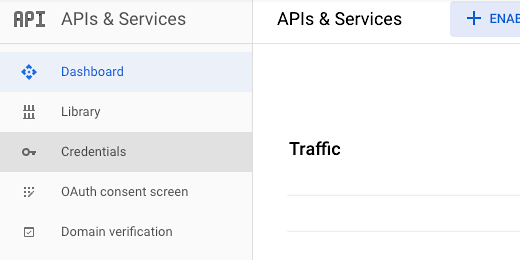
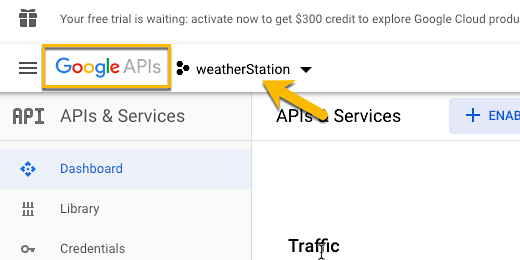
Click the Google API menu. Select the Dashboard from the APIs & Services option.

We need to enable one more API. Click the button to enable APIs and Services.

Click the Google Drive API tile. Enable the Google Drive API. Return to the Dashboard once the Google Drive API is enabled.

We are going to create credentials in our Google Sheets API. These credentials authorize the app on our Raspberry Pi to access a Google Sheet. Select the Credentials option.
Click the Create credentials button.

Select the option to create a Service account key.

Click the Service account selector.

Select the option to create a New service account.

Provide a name for the service account. Enter the name "piweatherStation".

The name is part of a service account that is similar to an email address. The service account ID is piweatherStation@weatherstation. I have hidden the rest of the information for security reasons. The rest of the address includes numbers and letters. It ends with the .com extension. We will need this information later.

Click the Role selector and choose Editor from the Project option. Click the create button.

A file is created with the credentials information. This file is downloaded to your computer. It downloads right away on the Chrome browser. Other browsers will prompt you to confirm the download.
An information message appears on the page. Close the message. The information in this file is for your account and Sheets API. Don't share it with anyone.

The JSON file is an acronym for JavaScript Object Notation. This file allows us to access the Google Sheet and send it information from our weather station. Create a folder on your computer desktop and title it "weatherFile". Place the JSON file inside this folder.
Chromebook users will create a folder in the download folder and leave the file here for now.
Don't close the Google Developers Console. We need information for one of the steps in the next lesson.
Weather datasheet
Our next step is to create a spreadsheet to receive the data. Open a new tab. Go to https://sheets.google.com. Click the Blank tile to create a new empty spreadsheet.

Click in the untitled spreadsheet name. Name the spreadsheet "piweatherData".

I know we are not including spaces in our files. Using this naming convention makes things so much easier later.
We need to share this spreadsheet with the API account we created in the last lesson. Click on the Google Developer's Console tab.
We are going to drill down from the beginning to get the information we need. I am doing this for those of you that might have closed the tab. I also want you to know where the information is for future reference.
Go to https://console.developers.google.com and login if requested. Click on Select a project. The link is next to the Google APIs logo.

If you didn't log out then you will see the weatherStation project in the project selector. Click the weatherStation API link.
Click the weatherStation project API link.

We are taken to the weatherStation Dashboard. Click on the Google Sheets API link at the bottom of the dashboard page.

Click the credentials link.

Look for the service account piweatherstation email account. Click on the link to open the account settings.

The email appears on the settings page. Highlight the email. Right-click and copy the email.

That's all we need for now. Return to the Google Sheets we just created. Click the Share button.

Right-click inside the email field and select paste.

Leave account with edit permissions. Click the send button.

We are done with the APIs and Google Sheets setup. We will return our attention to the Raspberry Pi in the next lessons. Keep the JSON file on your desktop on Chromebook download folder. It will be used in the following lessons.
Weather Station Project: Lesson 4
In this lesson, we connect the DHT 11 temperature and humidity sensor to the Raspberry Pi. The sensor is attached to a breadboard. Leads are used to connect the sensor pins to the GPIO pins on the Raspberry Pi. On the Pi, we download the DHT sensor library from Adafruit. The library has an example code to test the sensor. We will edit the example to read the sensor information.

Temperature and humidity sensor
Introduction
In this lesson, we connect the DHT 11 temperature and humidity sensor to the Raspberry Pi. The sensor is attached to a breadboard. Leads are used to connect the sensor pins to the GPIO pins on the Raspberry Pi. On the Pi, we download the DHT sensor library from Adafruit. The library has an example code to test the sensor. We will edit the example to read the sensor information.
Connecting the sensor
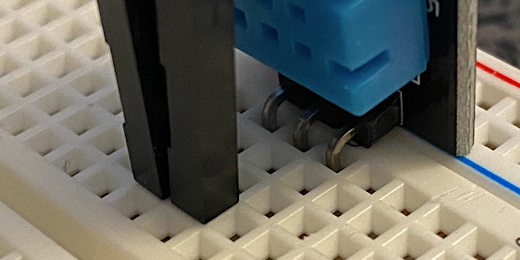
The temperature and humidity sensor is in the Elegoo Adruino kit. The sensor is model DHT11. This model number is important We will refer to it a few times in this lesson. The sensor is shown in the image below. The sensors themselves are enclosed within the blue plastic cover. The bottom of the sensor has three connectors. One connector receives power from the Raspberry Pi board(vcc). Another connector sends information to the Pi(data). The third connector is the ground connector.

The kit comes with a CD that contains information and resources for the modules and sensors. Most computers don't come equipped with a CDROM. To get the information for the DHT11 sensor we need to use the Internet. The information for the sensor is found using the link below. I have replicated some of the important information we need for the project.
http://www.circuitbasics.com/how-to-set-up-the-dht11-humidity-sensor-on-an-arduino/
The first pin on the left connects to the Raspberry Pi's GPIO pin. It outputs both temperature and humidity information. The second pin is referred to as the Voltage at the Common Collector, Vcc pin. The sensor module accepts voltages ranging from 3.3 volts to 5.5 volts. The third pin is the ground pin.
The breadboard
We need a breadboard to connect the sensor to the Raspberry Pi. The Elegoo kit contains a solderless breadboard. It looks like the image below. A breadboard contains a series of holes. The holes are organized into columns and rows. On either side of the breadboard are red and blue lines. The red lines have a plus symbol at either end. The red lines have a negative symbol at either end. All the holes along the red line are linked to each other. The same is true for the holes along the blue line. These are used to provide electric current for circuits. They are referred to as the negative and positive rails. This is because they are like the rails of a train track.
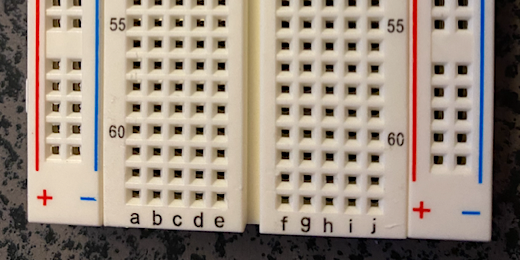
There is a groove down the center of the breadboard. It is often referred to as the trench. This divides the connections on the breadboard. This is also the reason why there are two sets of red and blue lines.
The columns for the holes between the rails are labeled with letters. The holes in these columns are not connected down the column like the negative and positive rails. The holes are connected in rows. For example, the holes from row a to e are connected. One row does not connect to another row.
The wires from the sensor plug into the holes on the breadboard. Handle the sensor carefully. You should use the static strap when handling any sensor. Get the sensor module and plug it into the breadboard. Each sensor connector goes into a separate hole. Each hole needs to be part of a different row. I recommend placing the sensor module in the center of the board along column 'a'. The sensor module in my image is between rows 25 and 35. Plugin the sensor so the blue sensor housing is facing the center of the breadboard.

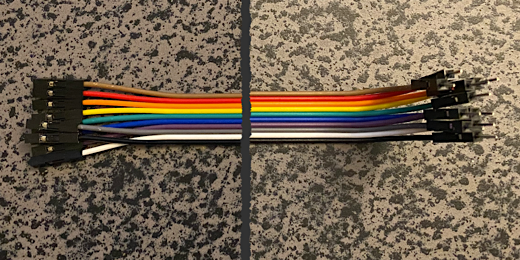
Lead wires
In the kit, you will find several wires. These are called Lead wires. They are used to make connections between electronic components or modules. There is a bundle of long lead wires. One end of each wire has a pin. The other end has a receptor for a pin. The wires are joined together but they are easy to separate. You need three lead wires. Get a red, green, and black wire. Red wires are used to identify connections to electric current. Green wires are used to identify connections to ground. Black wires are used for data but we can use any color for the data.
Get the pin end of the black lead wire. Plug it into one of the holes in the row for the data pin on the sensor module. Remember, all the holes in a row are connected.

Get the pin end of the red lead wire. Plug it into the row for the Vcc pin on the sensor.
Get the pin end of the green lead wire. Plug it into the row for the ground pin on the sensor module.

Raspberry GPIO pins
We are going to connect the sensor to the Raspberry Pi. Make sure the Pi is shut down and the power source is disconnected.
Pins are sticking out of the Raspberry Pi. These are referred to as GPIO, General Purpose Input/Output pins. There are 40 pins.
The pins are not labeled on the board. To know which pins to use we need to look at the pinout key for the board. I have created a pinout table for the board. The image of the table and bard is shown below. The table represents the various voltage, ground, and GPIO pins. I have drawn lines for the pins we are using to connect the sensor module.
The first pin at the top of the board is pin 1. This pin provides 3.3 volts. The pin next to it provides 5 volts. Our module is capable of using 5 volts. Most lessons with this module use 3.3 volts. The ground pin is on number 6.
The voltage and ground pins are different from GPIO pins. GPIO pins do not provide voltage. They send and receive information.
There are several GPIO pins to use. I chose to use GPIO23.
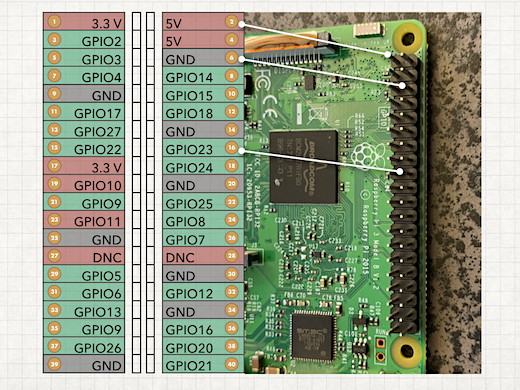
Connect the other end of the lead wires from the sensor to the corresponding pins on the Raspberry Pi. Red goes to pin 1, green to pin 6, and black to GPIO23.
Make sure the Raspberry Pi is not powered on. Never connect or disconnect any circuit to the Raspberry Pi while it is powered. Doing so could damage or destroy the Raspberry Pi. It could also damage modules and sensors.

Get the micro USB power cable for the Raspberry Pi and plug it in. You can connect the Raspberry Pi to an external display if you want. There is no need because you won't see anything. Everything is done and viewed through the SSH terminal window. Wait until the green light on the Pi stops blinking before attempting to log in with SSH.
DHT sensor packages
We need to install the DHT sensor packages. These packages are used by Python and our code to retrieve data from the sensor module. Type sudo pip3 install Adafruit_DHT. The packages are created and maintained by Adafruit. Adafruit creates and sells a variety of sensors and modules for Raspberry Pi and Arduino.
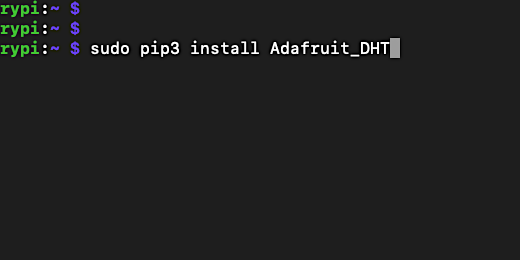
Sensor libraries
There are some libraries available to help us get started. Libraries are resources to help make the process of connecting top sensors and other components easier. The libraries include some examples for using the DHT sensor. One of these examples includes the code for accessing the Google Sheet for our data. Using this example will save us some time.
To get the files we need to set up a free GitHub account. GitHub is an online repository for storing, sharing, and distributing code. It is used by millions of develops to store their projects and share them with the world.
You don't need to be a programmer to get a GitHub account. Although, with all the work you have done so far I think you qualify. Go over to github.com and create an account. All you need is an email address. Remember the username and password for the account. We are going to need it in the next few steps. Keep the browser open and remain logged into the account.
We need to install the Git service onto the Raspberry Pi. Type sudo apt-get install git -y. This is similar to previous installations. The final command in the line includes '-y'. This is a command-line flag. When installing packages we are often prompted to confirm the installation. The process stops and waits for our response. The '-y' instructs the installation service to agree to the installation for us. This saves some time.

After the installation is complete we need to configure our account to retrieve content from Github. Type git config --global user.name "Your Name". Replace "your name" with the username created in the Github account. Leave the quotation marks don't erase them. You won't get a response unless the username is wrong.

Type git config --global user.email email@example.com. Replace email@example.com with the email used to create your Github account. You don't need the quotation marks for the email information. That is all there is to it.

We are ready to download the Adafruit DHT libraries. We need the address to the libraries in Github. The libraries are available from this URL, https://github.com/adafruit/Adafruit_Python_DHT. Copy this link. Paste it into the command line after typing git clone. Type git clone https://github.com/adafruit/Adafruit_Python_DHT.

The library is downloaded and saved to the Pi account home directory. We haven't looked at the home directory yet. Type ls -l to get a listing of the items in the home directory.

There is one directory. This is the DHT-sensor-library. A directory is like a folder. We know this is a directory because of the letters displayed on the right. The directory information contains letters that identify the permissions available for the directory. The letter d identifies this as a directory. The letter r means we have permission to read or see the contents. The letter w means we have permission to write or change the contents. There are several levels of permissions. That is all we need to know for now.
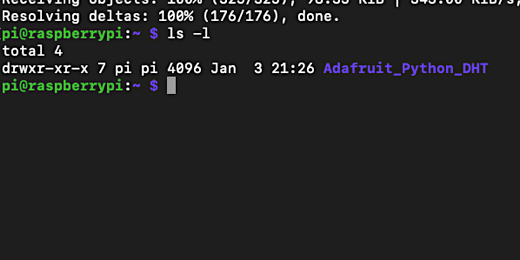
Reading sensor data
The repository library we downloaded from Github contains some sample files. One of these sample files reads information from the sensor. We are going to open the directory to see the sample file. Type cd Adafruit_Python_DHT/. The cd command is used to change the directory. Think of it as opening a folder on your computer. We are moving from our home directory into the DHT library directory.
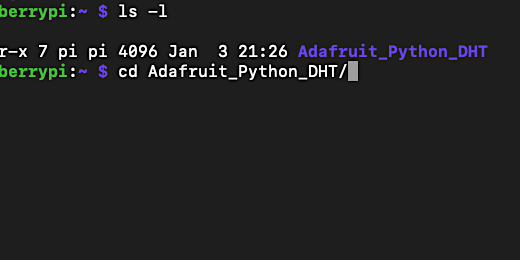
Type 'ls -l' to see a listing of the files in the folder.

There is another directory named examples. Type 'cd examples/'.

Type 'ls -l' to get a list of the items in the directory.

We are going to use the simpletest.py file to get information from the sensor. Before using the file we need to make some modifications to code in the file. We will use a text editor that runs from the command line. The text editor does not have a graphical user interface like modern editors. Use arrow keys and keyboard commands to move around.
To open the file for editing we type the name of the text editor followed by the name of the file to edit. The name of the text editor is called nano. This is not the only text editor but it is one of the easier ones to use for those new to command-line editors. Type 'nano simpletest.py'. The '.py' is the file extension and identifies this as a Python file.

The command-line screen is replaced by the nano text editor. There is a lot of commented text at the beginning. This commented text is information regarding the file. The cursor appears at the top of the text file on the first line.
The '#' is used to comment text. This text is different from instructions sent to the Pi or sensor. It is usually information that documents what the code does. Most programmers thoroughly document their code.

cursor location at the beginning of the file
Use the down arrow key on your keyboard to move the cursor to the line that begins with the word sensor. This line identifies the sensor we are using. The sensor is currently set to the DHT22. This is a newer version of our sensor the DHT11. I will go over the differences in a future lesson.
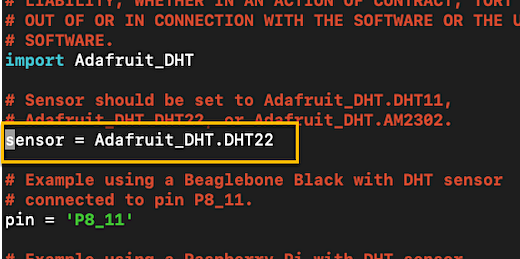
Use the right arrow key to move the cursor to the end of the line.

Press the backspace key on Windows or the Delete key on Mac to erase the number 22. Type the number 11 after DHT.

Use the down arrow key to move the cursor to the line that begins with the word pin. The cursor moves down the lines relative to its last position. This is why the cursor rests at the end of the line.

The code in this example is set up to work with a different device. The PIN is set for that device. The device is called a Beaglebone. Our device is the Raspberry Pi. To work with our Raspberry Pi we need to change the PIN. The sensor is connected to GPIO23. Erase the pin information and type the number 23.
The commented information provides information for providing the number when using a Raspberry Pi. This an example of documentation by the programmer of this example.

Move the cursor to the bottom of the text file. The last few lines are what retrieves the data from the sensor. The instructions get information from the sensor.
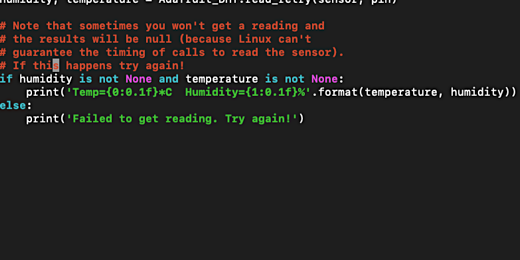
The first line, if humidity is not None and temperature is not None:, checks to see if the sensor is sending data. The 'not None' is asking if there is something.
The second line has several components. It prints the temperature and formats it using from the instructions.
The code “print ( 'Temp = *c” instructs Python to show the temperature with one decimal value. The number one after the decimal point sets the number of decimal places. The letter 'f' is used to format the number as a floating-point value. This means the value includes decimals. The letter 'c' returns the temperature in Celsius.
Floating-point values are used when the number contains decimals. Numbers that do not use decimal values use Integer values.
The code “Humidity = %” displays the humidity value with one decimal place value. The percent symbol is used to represent the value as a percentage.
The “.format(temperature, humidity)” describes the order in which the information is to be displayed.
The last line runs if there is no information from the sensor. A message appears and the code returns to the beginning and listens for information from the sensor. If everything goes well we will not see this line.
We need to save the changes. The bottom of the editor provides information on how to do that. The little arrow symbol next to the letters represents the Control key on your keyboard. To save the information we press the Control key and the letter 'o' at the same time.

The name of our text file appears. We are asked to confirm that we want to save changes to the file. Press the Return key to confirm. This is similar to File and Save as in a word processor.

Press the Control key and the letter 'x' to exit the editor.

We are returned to the command line. To run the program we need to type the application and the file to be opened. Type 'python3 simpletest.py'.
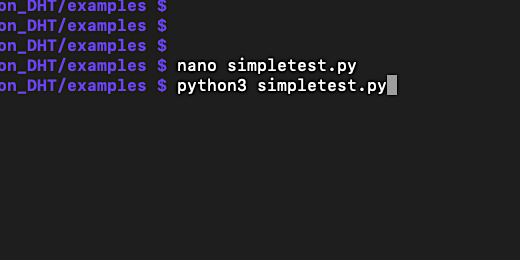
The program responds with the sensor data. In my example, the temperature is 24 degrees Celsius. The humidity is 22 percent.

The script will continue to return the sensor temperature and humidity information every 30 seconds. The script contains a loop that continues until we stop the script. Press Control+C to stop the script. The command prompt will display after the last reading.
Run the script again at anytime by typing the same command.
Don’t forget to shutdown the Raspberry Pi before disconnecting the power. Log back in if you forget to shutdown before quitting the SSH terminal session.
If the sensor does not work then here are some things to try. Make sure the connections are correct. The lead wires on the sensor should be firmly in place. The lead wire colors from left to right are black, red, and green. The red wire is on pin 1 on the Raspberry Pi to receive 3.3 volts. The green wire is on pin 6. The black wire is on GPIO23. This is physical pin 16.
If it still doesn't work then check the simpletest.py file. Use the nano editor to open the file. Make sure there are no stray characters. Make sure everything is typed correctly. Save the file and try again.
Weather Station Project: Lesson 3
This is lesson three of our weather station project with a Raspberry Pi. In these lessons, you will learn how to Find the Raspberry Pi’s IP address Login into the Pi with SSH Update the Pi location and time zone Update the Raspbian operating system Install applications and services Shutdown the Raspberry Pi

Introduction
In these lessons, you will learn how to
Find the Raspberry Pi’s IP address
Login into the Pi with SSH
Update the Pi location and time zone
Update the Raspbian operating system
Install applications and services
Shutdown the Raspberry Pi
Raspberry Pi connection
The Raspberry Pi has connections for a display. The USB ports are used to connect a keyboard and mouse. The weather station does not need a display, keyboard, or mouse. For these lessons, we are going to connect a display. This gives us a sense of what is going on. It is useful for first-time users to get some visual feedback. Connect an external display to the Raspberry Pi with an HDMI cable. Don't connect a keyboard or mouse.
We are going to run the Raspberry Pi in what is called the headless mode. This means we are not going to physically connect to the device when working with it. We are going to log into the Raspberry Pi from another computer. This is very useful because we can use any computer. The Pi will be controlled by your Mac, Windows, or Chromebook. I have instructions for each.
If you are using Raspberry pi (version 1.xx or 2.xx) without wireless capabilities you need to connect it with an Ethernet cable to a router. The Ethernet cable usually connects to a drop. This is a port on the wall. The cable is also connected to a Router. Below is an image of a wireless router and the Ethernet ports on the router. Raspberry Pi 3 and 4 with wireless capabilities don't need an ethernet cable.

Use the power adapter that came with the Raspberry Pi kit. Plug the adapter to a wall outlet. The Raspberry Pi doesn't have an independent power button. It will turn on once the Pi is connected to a power source. Plug the other end of the power adapter to the Raspberry Pi micro USB connector.

Don’t unplug the Raspberry Pi until everything is setup. Unplugging will turn off the power and crash the computer. You might need to start all over. At the very least, you will need to connect a keyboard and mouse to the Pi and fix some issues.
A couple of lights on the Pi will turn on. A red LED indicates the Raspberry Pi is on. A blinking green LED shows there is activity on the Pi. This activity is usually from the Pi reading and writing information to the micro SD card. The green light will blink for a few minutes while the Pi boots. Eventually, the LED will stop blinking. This means the Pi is waiting for instructions from us.
What do we see on the connected display? The Raspberry Pi displays lines and lines of text as it boots. It configures everything for us. It looks for the SSH file to setup SSH services. It looks for the WPA file to set up the wireless connection. If the green LED doesn't blink and nothing appears on the display this may be because the microSD card isn't properly inserted. Check the card to make sure it is properly inserted.
Unplug the power supply to the Raspberry Pi before checking the microSD card.
Raspberry Pi IP address
We need to know the IP address for the Raspberry Pi. This is needed to log into the Pi with Secure Shell, SSH. I reviewed the process for getting the IP dress using Mac, Windows, and Chromebook. All three use their version of the command line.
Mac Terminal IP address lookup
As long as your computer is part of the same network we can look up the IP address of the Raspberry Pi. Open the Terminal on Mac or Windows and type this command, ping -c 3 raspberrypi.

This command sends a chunk of information to the host identified as raspberrypi. It looks for this host on the local network. Once it finds the host it sends information to confirm the host is communicating with the network. The ping identifies the IP address of the host. The IP address for my Raspberry Pi is 192.168.1.63. Look at the IP address for your Pi and write it down. There is a parameter between the ping command and the hostname. This parameter instructs the ping command to limit the pings to three.
The IP address will change if you move the Raspberry Pi to another location. If you do move it, run the ping command to get the new IP address. You will be moving the Pi to gather temperature and humidity information from various locations.

Windows IP address lookup
We are using the command line again to get the IP address of the Raspberry Pi. This IP address is needed so we can log into the Pi with SSH. Go to the Windows search box and type CMD to open the command line. Type ping raspberrypi.

The command will ping the network looking for the host named raspberrypi. It will send packets of information to confirm that the host is communicating. The ping command will send four packets. The IP address of the Raspberry Pi is returned. The IP address for my Pi is 192.168.1.63. Get the IP address for your Pi and write it down. You will need it in the next lesson.
Chromebook IP address lookup
The Chromebook has a version of the command line called the Chrome Shell, Crosh. Use the keyboard combination CTRL+ALT+T. A tab opens and displays the Chrome Shell prompt.

Type ping -c 4 raspberrypi. We need to enter a count for the number of pings. The command will continue to ping the Pi until we interrupt it with CTRL+C.
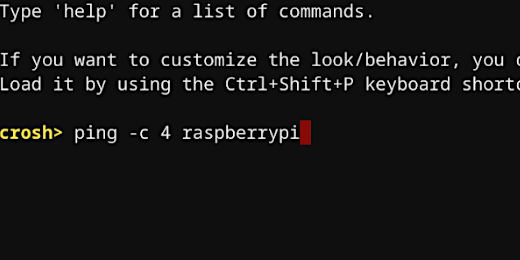
The ping command will look for the Raspberry Pi with the hostname "raspberrypi". It will send four packets to the Raspberry Pi. This tests the Pi's ability to communicate on the network. Part of the information returned includes the IP address for the Pi. The IP address for my Pi is 192.168.1.63. Look for the IP address of your Pi and write it down. We will need it in the next step.

During these lessons, I will use the IP address for my Pi. Please replace my IP address with the one for your Pi.
SSH Mac Login
To access the Pi we will use the SSH connection. The Pi is connected to our router and has received an IP address from the router. This is true for both the wireless and ethernet connections. The Raspberry Pi will be assigned an IP address. An IP address is a set of numbers divided into four sections of three numbers each. A typical router address looks like this, 192.169.001.122. The IP address provided to the router is unique. We need to find the address assigned to your Raspberry Pi.
Type clear at the prompt. This clears away the information in our terminal. Type ssh followed by a space and the word pi. We are opening the ssh application to login to the Pi account. This is the default account. Type the "@" symbol. Enter the IP address for your Raspberry Pi after the "@" symbol. We are instructing the SSH application to access the device at the given IP address. It will then attempt to log in with the account name "pi". Press the Return key.
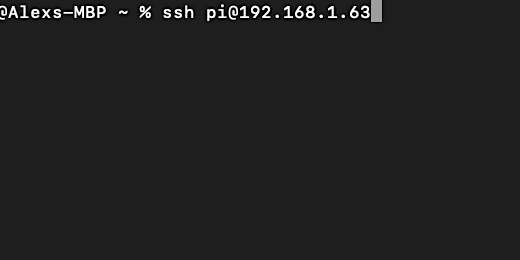
The Raspberry Pi will reply to your attempt with a password prompt. The password for all new Pi accounts is “raspberry”. The password information is hidden so you won’t see the letters as they are entered. Type the password and press the Return key.

You will see the Raspberry Pi Raspbian command prompt. The latest version of macOS might return a login attempt error. In that case, you will need to use the command instructions below.
Mac SSH error
We need to clear the ssh keys on the host. Type the command below. Replace the IP address with that of your Pi.
ssh-keygen -R 192.168.1.163
Windows SSH Login
Type “cls” to clear the contents of the command window. Type ssh pi@192.168.1.63 at the command prompt. Replace my IP address with yours.

The Raspberry Pi doesn’t have any security settings enabled yet. You are prompted to confirm the connection. Type yes and press the Return key.

The Raspberry Pi prompts us for the Pi account password. The default password is “raspberry”. Type raspberry and press the Return key to log in. The password is not displayed as it is typed. This is for security reasons. Type it carefully.

The password is authenticated and you are logged in. The Raspberry Pi command prompt is ready for our instructions.

Chromebook SSH login
The Chrome Shell does not include the Secure Shell application. We need to install it. It is available in the Chrome Web store. Open the Chrome web store. Search for the Secure Shell Extension. Click the Add to Chrome button to install the extension.
Click the extension icon after the installation is complete.
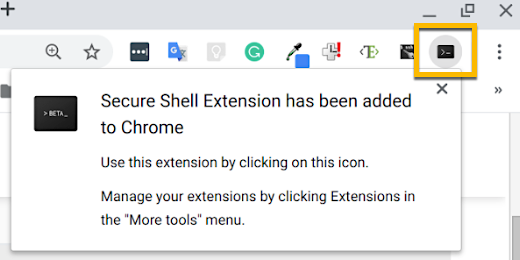
Click the Connection Dialogue option.

A configuration box opens where we provide the account information needed to log into the Pi.

Type pi@ followed by your IP address into the first input box. The extension fills in the account name and the IP address for the other boxes. Press the Enter key on your keyboard.
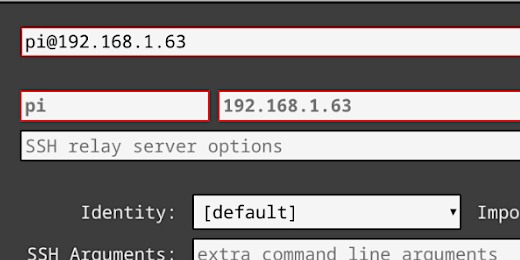
We are prompted to allow the extension to open SSH links. Click the allow button.

We are also prompted to allow the extension to open web and SSH links. Click the allow button.
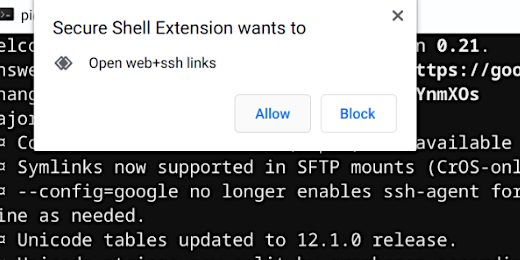
We are prompted to confirm the connection to the IP address with SSH. Type yes and the Return key.
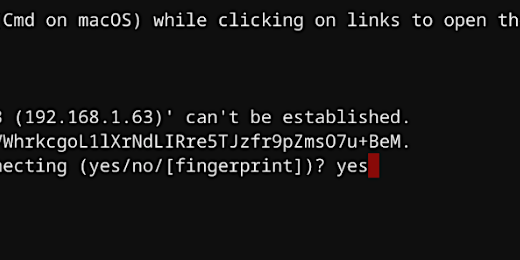
Provide the password for the account on the Raspberry Pi. The password is “raspberry”. The password does not appear as it is typed. This is done for security reasons. Type the password and press the Return key.

The SSH extension updates with the Raspberry Pi command prompt.

The extension remembers the connection information. The extension displays this information the next time we want to connect. You still need to provide the password.

Raspberry Pi password
From this point forward everything will be related to the command prompt. I won't be jumping from computer to computer to explain different methods.
Leaving the default password set to raspberry is never a good idea. The first thing we need to do is change the password. Type passwd followed by a space and the account name pi.

The password doesn’t have to be complex. Use at least eight characters. Write the password down somewhere. We need to verify the password change by entering the old password. This would be the current password, raspberry. Type the current password when prompted.

The password will not be displayed as it is entered. Type in a new password. Press the Return key to update the password. You will be prompted to type the new password again.

Raspbian is constantly being developed and updated. Those updates aren’t always included in the installer. We need to check for updates and install them.

You might have the Pi connected to an external display. This was useful when the Pi booted. Since then the display has been silent. This will be true for the remainder of our lessons. Keep it connected for the remainder of these lessons. The final lesson covers the process of shutting down the Pi.
Configure services
We need to configure some basic services before proceeding to the next step. Type sudo raspi-config followed by the return key.
Instead of repeating the instruction to hit the return key, hit the return key after a command-line instruction.
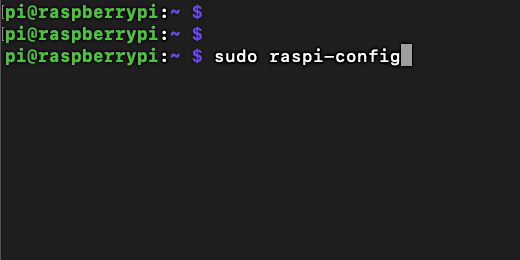
The configuration tool is very useful. The top of the tool panel provides information about the model and version of the Raspberry Pi. The configuration tool provides a list of settings and services we can change.
Set location and time
The Raspberry Pi doesn't get and set the date and time information for the location. We need to set this manually. This information is important for sensor data. Use the down arrow key to select the localization options. Press the Return key.
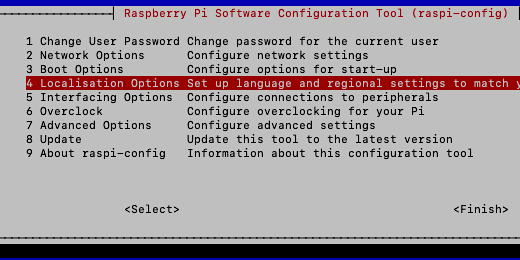
Press Return to set the location information. The terminal will go blank for a few seconds. The Pi is retrieving the needed information.

A list of locations is displayed. The locations are listed in the UTF-8 format. The UTF-8 format lists the location language followed by the territory. For example, en_US is for English and United States. Select the UTF-8 for your language and country. Press the space bar to select the location. An asterisk appears in the location square.

Press the tab key to jump to the OK. Press the Return key to update the location.

You will be prompted to select a language region if applicable. In this example, I am prompted to choose between British English or American English. Select a regional language and press the Return key.

The process could take a minute or two. The terminal will update with process information.

The main menu appears when the process is complete. Select the localization options again. We are going to set the time zone next.

Select the option to change the timezone.

Use the up or down arrow key to select your country. Press the Return key.
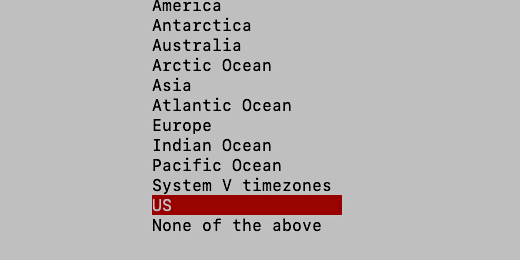
Use the arrow keys to select your time zone. Press the Return key to mark the time zone.

The main menu will return once the process is complete.
Hostname
The hostname for the Raspberry pi is "raspberrypi". This is the hostname we pinged to discover the IP address. We must change the hostname. There are several reasons for changing the name. One reason for changing the name is that others on your network might need to set up their Raspberry Pi. Pinging the hostname "raspberrypi" will return several results. One of them is your Pi. Changing the hostname will prevent them from getting a ping from your Pi. Select network options.

Select the hostname option.
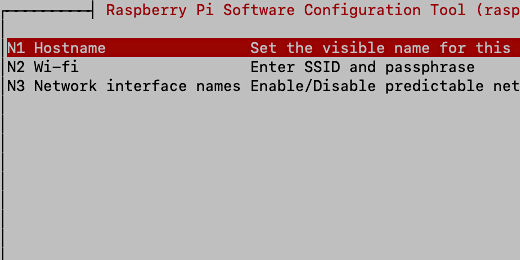
An information box provides important information regarding hostname options. We can only use letters and numbers in the hostname. A hyphen is also allowed. Press the Tab key and the Return key to continue.

The current hostname appears. Press the delete or backspace key to erase the name. Provide a name that is relevant to the Pi.

I recommend changing the hostname to "weather-pi". I use the hyphen to separate the words. Blank spaces are not allowed in hostnames. Press the Return key to update the hostname.

Press the tab key twice to select Finish. Press the Return key.

Changing the hostname requires a reboot. Proceed with the reboot. You will need to log back into the Pi after it has rebooted. Use the SSH terminal, command prompt, or extension on Chromebook.
Raspbian Updates
We need to check for available updates. The updates are available from a repository common for many versions of Linux. Raspian is a version of a Linux distribution called Debian. The repository of updates for Debian is maintained by the Linux community. Type sudo apt-get update.

The installation of updates often require administrative level permission. The term "sudo" is used to perform updates, installations, or changes as the administrator of the device. The term stands for Super User Do. Super User is another term for the computer administrator. By typing the "sudo" command we are instructing the operating system to look for updates.
The updates are retrieved and installed using "apt" service, the Advanced Packaging Tool. This application is used to update and install packages. After "apt" is a hyphen followed by the word get. This instructs the packaging tool to get the available updates for Raspbian.
The APT application connects to the repository of services for Raspbian. It begins to download a series of packages. These packages contain instructions and information for the updates available. Think of it as a list of items available for installation on Raspbian.
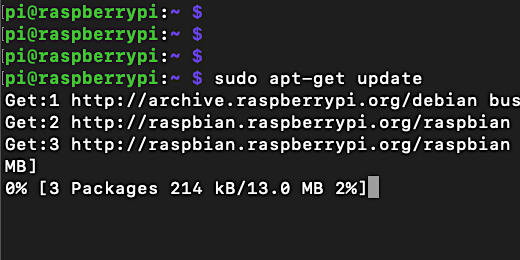
The process is fast. The list is ready to begin retrieving and installing updates.

To install the updates type sudo apt-get upgrade. This instructs the package tool to upgrade all the services that need upgrading.

The upgrade process takes several minutes to complete. The terminal will scroll with lines of information. This information represents the services and applications that are being upgraded. The upgrade tool on my Pi will upgrade 63 services and download 149 MB of files to perform those updates. The number of services and file sizes may vary on yours.
Before the upgrade begins we are prompted to confirm the upgrade process. Type the letter Y and press the Return key.

You can step away from the computer for the upgrade process. Return after five or ten minutes to respond to a message that will appear somewhere in the process. Type q to finish the upgrade process. You might receive other prompts. It depends on the upgrades. You might need to type yes to another prompt.

If you are looking at the Raspberry Pi on a display then all you will see is the Raspberry Pi login prompt. All the action is going on in the terminal window.
Type clear at the command prompt after the updates are done. This will clear the terminal window for the next steps.
Python and Google Services
In a future lesson, we will set up Google APIs to collect information from the weather station. To send information to the Google API for Google Sheets we need to set up applications and services.
We are using Python, a programming language to communicate between the Pi and Google’s API. We are going to update Python and some of the services. The update process is similar to the update for the Raspbian operating system. These updates don’t take as long as the updates we just performed.
I want to make sure we have them installed with the latest updates. This process is useful so that you understand what services are being used and how they got there.
Python updates
Python is a popular programming language. Versions 2 and 3 are installed on our Pi with Raspbian. Type sudo python --version. This shows version 2.7.16 is installed on my Raspbian.

We are going to use the latest version of python. Type sudo python3 --version. The version installed on my system is 3.7.3. Yours might be newer.

We need to install some additional packages for Python. Type sudo apt-get install python3-dev. This command is similar to the update command. This command includes the install parameter. The APT package tool will download and install the Python 3 development files.
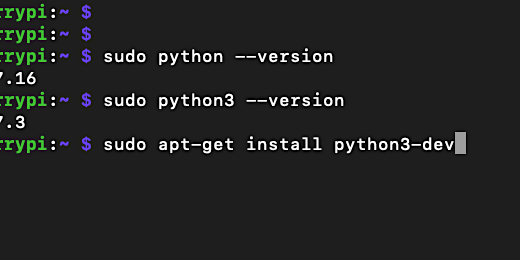
Type the letter y to confirm the installation of the Python 3 development packages.

We will install the Python Package Index. This is a package manager for packages written in Python. Type sudo pip apt-get install python3-pip. Type the letter y when prompted to continue with the installation.

I want to make sure other Python services are up to date. Type sudo python3 -m pip3 install --upgrade setuptools. This time we didn't use the apt-get command. Python has services through PIP to get and install packages. Type y at the prompt to confirm the setuptools update.
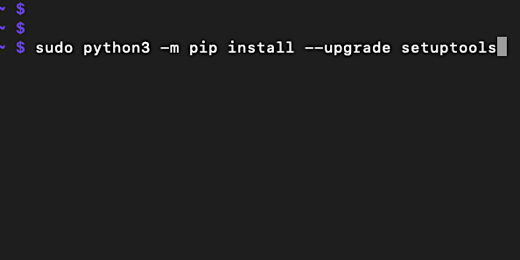
Python will search for any updates to the setuptools. It will install those updates if any exist. The terminal window might not display any text for a while. This is normal.
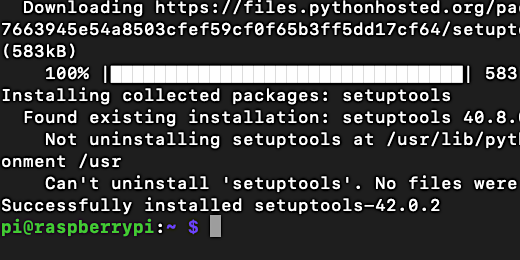
Type sudo python3 -m pip install --upgrade wheel. With this command we are now finished with our updates for Python 3. In the next step, we will install Google services for Python.

Google Services for python
Go ahead and type clear to refresh the terminal window. Type sudo python3 -m pip install --upgrade gspread. This instructs the Python package installer to locate and install the gspread package.
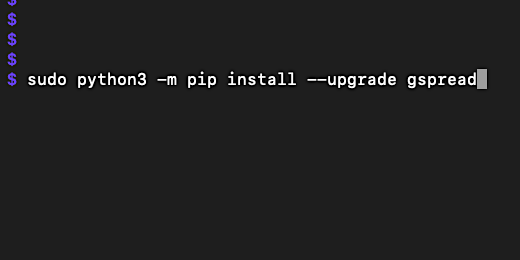
After a few seconds, you will see the installation progress.

The “gspread” packages and Python need to communicate with the Google Sheets API. Communication takes place over secure services through Google. This installs a client package that is used to authorize our access to the Google Sheet. We need to update the secure services on our version of Python. Type sudo python3 -m pip install --upgrade oauth2client.
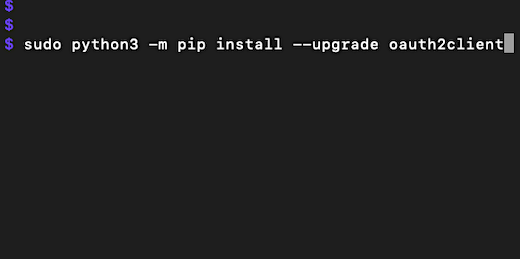
We need one more package to access the Google Sheet API. Type sudo python3 -m pip install --upgrade PyOpenSSL. Google uses secure services for all its products. This is easily identified by the ‘https://“ and the lock icon in the address bar. The Open SSL package allows us to access these services.

Shutdown
We are done with everything for these lessons. We need to turn off the Raspberry Pi. The Pi is like all computers. It needs to shut down before disconnecting.
Type ‘sudo shutdown -h now’ and press the Return key.
The display connected to the Pi shows information related to the shutdown process. It is terminating applications and processes. It is also closing files and removing unneeded temporary files.
The whole shutdown process takes a few seconds. The terminal window will display a message informing you that the SSH session is closed. You are logged out of the Raspberry Pi and the SSH application on the Pi has stopped accepting requests.
Disconnect the micro USB cable from the Pi.
Practice booting the Pi and shutting it down. This will give you a sense of how long it takes the Pi to boot and shutdown.
Weather Station Project: Lesson 2
This is the second lesson in our weather station project. These are the steps covered in the lesson. Download the Raspbian operating system (lite version). Flash the image onto the MicroSD card. Create an SSH file to access the Raspberry Pi remotely. Create a configuration file to connect with your Wifi.

Introduction
This is the second lesson in our weather station project. These are the steps covered in the lesson. Each step is covered using Mac, Windows, and Chromebook.
Download the Raspbian operating system (lite version)
Flash the image onto the MicroSD card
Create an SSH file to access the Raspberry Pi remotely
Create a Wifi configuration file to connect with your Wifi
Insert the MicroSD card into the Raspberry Pi
Download Raspian OS
The Raspberry Pi uses an operating system based in Linux. Linux is a free and Open Source operating system. Linux, in one form or another, is responsible for the Internet. Most web pages are hosted on Linux. Linux is found in many devices from home thermostats to smartphones. The Linux for the Raspberry Pi is called Raspian. It is built specifically to run on the Raspberry Pi. It is not the only version but it is the one we will be using.
The Raspian operating system was installed on the micro SD card we just erased. Why did we erase the card then? I want you to understand the process of getting a Raspberry Pi up and running from scratch. This process will help you prepare a Raspberry Pi anytime. The download process is the same for Windows or Mac.
The operating system is available from the Raspberry Pi website. Go to “https://raspberrypi.org/downloads”. Click the Raspbian button.

There are three download options. The first two are typical download options. These versions contain many resources. These resources are very good if we plan to use the Raspberry Pi as a desktop device. We don't need all these resources for our projects. The full version is over two gigabytes. The desktop version is a little over one gigabyte. We will use the lite version. This is just a little over four-hundred megabytes. The small size is faster to download and install on the Pi. We will install and update the resources we need.

Click the Download zip option.
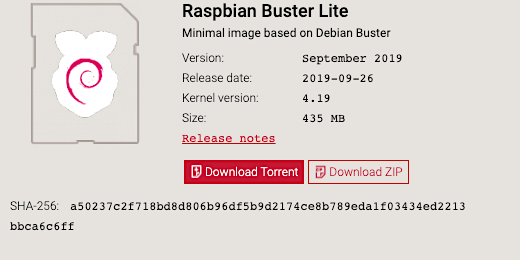
Wait for the Raspbian file to download. Find the file on your computer. Double click the file to extract the operating system image. Place the image file on your desktop. The Raspbian image file will have a name that begins with a date. The date is followed by raspbian-buster.img. The date of my image is September 26, 2019. The date on your image file might be different. 2019-09-26-raspbian-buster.img. The image file ends with the “.img” extension.
Flashing the micro SD card (Mac and windows)
We need a special program to help us place the image onto the micro SD card. We can’t just copy the file over. The process of flashing a micro SD card with the image is important. The Raspberry Pi will not be able to boot from the card if it is not properly formatted and flashed. The flashing tool is available from Balena. Go to https://balena.io/etcher.
The process to flash the MicroSD card with Balena Etcher is the same for Mac and Windows. I have instructions for doing this with a Chromebook in the next lesson.
The site recognizes the operating system of your computer. The download button will point to the version of Balenaetcher for your computer. I will download the Mac version. Click the triangle on the button to select another download option. On Windows, I recommend using the Etcher for Windows Installer option.
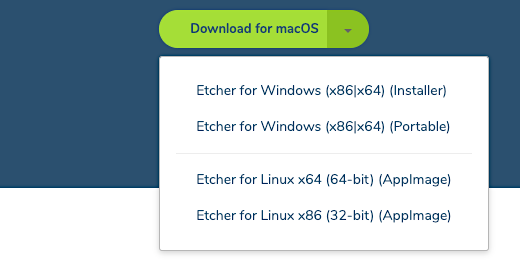
Download and install the Balenaetcher app on your computer. Mac users will copy the file to the Applications folder. Windows users will run the installer. Open the application after the installation is complete.
There are three steps in the process. We need to select the Raspbian image first. We then select the micro SD card for the destination. In the third step, we begin the process of etching the operating system. Click the "Select image" button.

Navigate to your computer’s desktop and select the image file. The file will appear as the selected image. Click the Select Target button.

Find the micro SD card and select it. The disk identifier might change if you connect another drive to the computer. Verify the device by checking the storage capacity. Click the continue button.
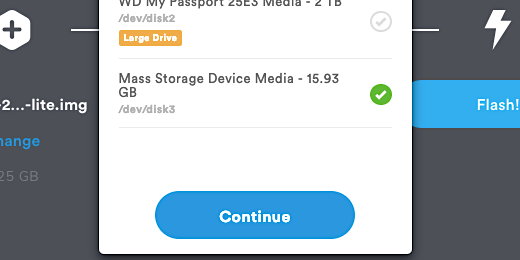
Verify the image file and the destination drive one last time. Click the Flash button. You will be prompted on Mac to enter your Admin password to authorize the flash process. Windows will ask you to confirm that you want Belenaetecher to modify the drive.

The Flash process takes several minutes. Don’t interrupt the process. The image will be Flashed onto the drive and verified. The verification process assures there were no errors during the process.

If there are errors here are some things to do. Reformat the micro SD card. Download the Raspbian image again and use the new download. Run Balenaetcher again and use the new image file. Delete the older image file. If you still get errors then you may need to use a different MicroSD card.
At the end of the process, you will be informed the Flashing is complete. You will be prompted to Flash another. We don't need to Flash another. Quit the Etcher application. The Etcher application ejects the drive at the end of the process. Unplug the adapter and then plug it back in. The microSD card should appear on your list of devices. On Mac, it will appear on the desktop. On Windows, it will appear in the File Explorer. Look for the drive titled BOOT.
Chromebook
We used the Chromebook Recovery Tool when formatting the MicroSD card. This same tool will flash the Rasbpian OS onto the MicroSD card. Insert the card in one of the USB ports on the Chromebook. Open the Chromebook Recovery tool. Click the gear icon. Select the option to use a local image.

Go to the download folder. Select the Raspbian image. Click the open button.

In step two, you are prompted to select the external drive. Click the selector. Select the MicroSD card. Click the continue button. Click the Create Now button.

The process takes several minutes. At the end of the process, you are prompted to finish or to create another. Go ahead and quit. Leave the drive connected to the computer for the next step.
The SSH file
We are not going to connect a keyboard, mouse, or display to the Pi. This provides an added level of flexibility. We don't need to dedicate a display to a device that doesn't need one to monitor the weather.
Without a display, keyboard, or mouse we need a way to communicate with the Raspberry Pi. We will use a protocol called Secure Shell, SSH. This is how network servers are managed. The SSH protocol is not automatically available when the Raspberry Pi boots for the first time. We need to include one piece of information so it is enabled the first time the Raspberry Pi boots. This file must be on the card before the Raspberry Pi boots with it for the first time.
By the way, running the Pi without a display, keyboard, or mouse is described as running in Headless Mode.
Enable SSH using Mac
Open the terminal application. Type cd /Volumes and press the return key. This takes us to the Volumes directory. The MicroSD, like other drives, is seen as a volume.

Type ls and press the Return key. A list of the mounted volumes will display. Look for the boot volume.
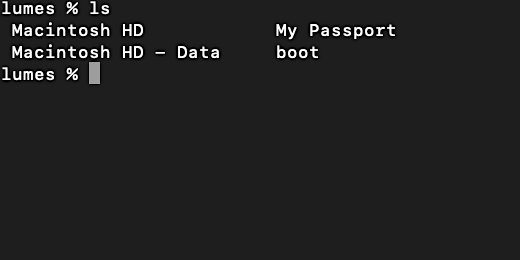
Type cd boot and press the Return key. This places us inside the MicroSD card.

Type "ls" and the Return key to see a list of the files on the card. We are going to add one more file.
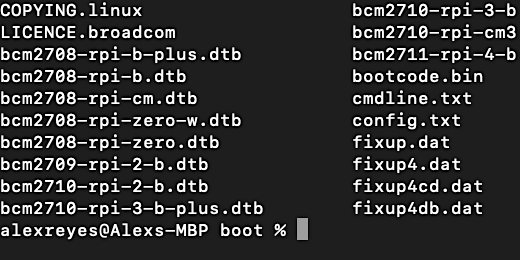
Type nano ssh and press the Return key. We are using a simple command-line word processor called nano. We have instructed the computer to use nano to create a file called ssh. The editor opens to begin editing the file.
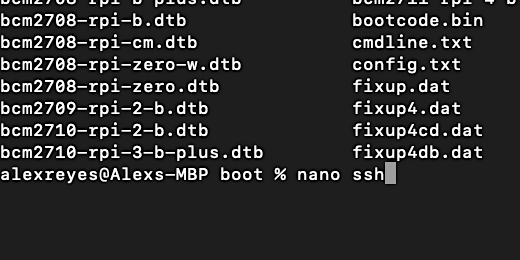
We are not going to place anything in this file. Don't change anything in the file. Don't even press the space bar or return key. We need to create a blank file for Raspbian to enable the ssh protocol on the first boot and setup.

There are commands at the bottom of the nano application. Press the Control key and the letter "o" at the same time. This will save the file to the microSD card. The little arrow next to the letter is called a carrot and it represents the Control key.

The ssh file name appears for us to confirm we want to write the changes to the file. Press the Return key. The changes are updated and saved to the drive.

A message appears informing us we saved a file with "0 lines" of information. If you have any number other than zero please remove any spaces or hard returns. Press Control and "o" to save the updated file.

Press the Control key and the letter X to exit the nano editor. We are going to create another file. This file enables and configures the WiFi. This is an important step so we can work on the Pi in headless mode. Go over to the connecting to the Wifi lesson.
Enable SSH using Windows
Open the File Explorer and look for the MicroSD card. The card is named boot. The files and folders in the drive are part of the Raspbian OS.

Right-click anywhere inside the drive where you see the files. Select the option to create a new text document.

A plain text document is created. The file name is selected so we can replace it with our own.

Type ssh and press the Return key. The file does not need an extension.
SSH on Chromebook
We need to create a plain text file. Google Docs create and export plain text files. I prefer to use a specialized text editor for code. The editor is available from the Chrome Web Store. Open the Chrome Web store. Search for "text editor". We are going to use a very simple text editor. The editor is an extension. Click the "Add to Chrome" button. Authenticate the installation.

Look for the extension on your browser. Click on the extension.

The editor opens with a newly created document. Don't type anything into this document. Click the "Save as" button.

Click on the MicroSD card drive. It is labeled as External Drive.

Double click the boot partition.
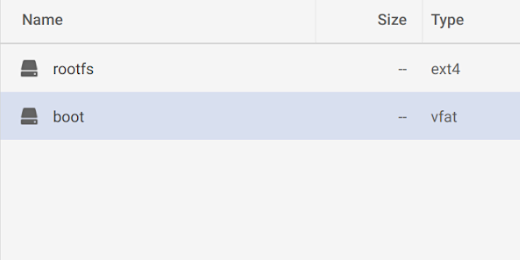
The boot partition contains the system files for Raspbian. Don't delete, open, or modify any of the files.
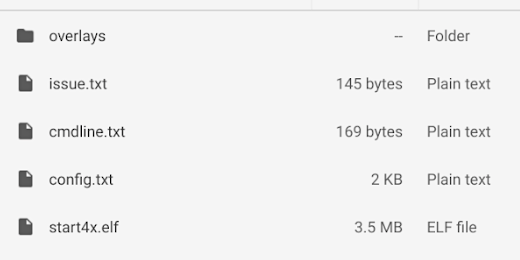
The editor creates a random name for the file. Erase the name and type ssh. Don't include the quotation marks.

Make sure to erase the ".js" extension.

Click the Save button when the ssh file is properly renamed. We don't need this file open. Click the "x" to close the document. Leave the editor open for the next step.
Connecting to the WiFi
The first two versions of Raspberry Pi did not come with built-in wireless options. Wireless connections for the Internet and Bluetooth became available with version 3 and continue with version 4, which is the most current version at the time of the writing of these lessons.
The built-in wireless connectivity with Raspberry Pi 3 makes it much easier to use for this project. The first and second versions of the Raspberry Pi did not include wireless capability on the board. They need an extra device to connect to a wireless network. The extra device is a wireless adapter. The adapter connects to one of the USB ports.
I tested several wireless adapter options. I found that the Edimax EW-7811Un 150Mbps 11n Wi-Fi USB Adapter works well with my Raspberry Pi. I am using the Raspberry Pi Model B+ version 1.2. The adapter is less than $15 and well worth it for this project. This device is also one of the recommended devices on the Raspberry Pi website.
Connecting to a wireless network is almost a must to be able to place the temperature sensor in a location that will measure the temperatures we want. We want the sensors to be exposed to the outside. There are very few locations that have network drops outside the building. Wireless networks often extend beyond the building for several feet.
To connect with an existing network we need to provide some information on the microSD card during the first boot. This information is provided in a text file. This will be just like what we did with the SSH file. The SSH file didn't include any information.
The configuration file for our WiFi connection will contain information for connecting to a wireless network. We need to include this information so that the wireless is configured and established for us.
Mac WiFi configuration file
Open the Terminal application if it isn't already open. Type cd /Volumes/boot if you are not in the MicroSD card boot volume.

We are going to use nano again to create the file. Type nano wpa_supplicant.conf and press the Return key.

The file contains lots of information and instructions. It is often easier to copy and paste the code into the file. Copy and paste the code below into the nano editor.
country=US
ctrl_interface=DIR=/var/run/wpa_supplicant GROUP=netdev
update_config=1
network={
ssid="YOURSSID"
scan_ssid=1
psk="YOURPASSWORD"
key_mgmt=WPA-PSK
}
The first line identifies your country. Change the line to match yours. The second line is used to control the wireless adapter through the wpa_supplicant configuration. The third line updates the configuration for the adapter. In the remaining lines, we provide the information for the wireless access network. The SSID or Service Set Identifier is the name of your wireless network.
Here are some basic instructions for navigating inside the nano editor. Use the up arrow on the keyboard to move the white square up. The white square is the cursor. Use the right arrow to move it to the end of the word YOURSSID. Make sure the cursor is highlighting the quotation mark. Use the delete key to erase YOURSSID. Type the name of your wireless network.

Press the down arrow key to go to the psk, passkey, line. Move the cursor to the end of YOURPASSWORD. Make sure the cursor is highlighting the quotation mark. Use the delete key to erase YOURPASSWORD and replace it with the password for your wireless network.
The password is case sensitive. Type it exactly or it will fail to connect. A failed connection means we need to manually configure the wifi. To do this we need to connect a display and keyboard to the P. It's messy. Please be careful.
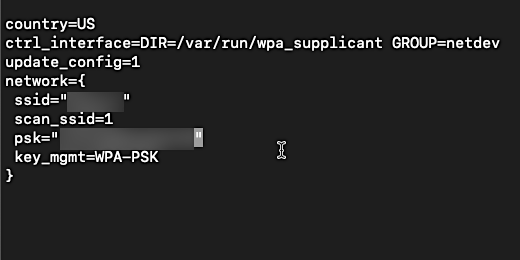
Once the information for your network is entered we need to save the file to the microSD card. Press the Control key plus the letter "o". This will save the information to the file. We are prompted to confirm the name of the file. Press the Return key to continue.

Nano will confirm the saving of the file to the microSD card. Press Control plus the letter "x" to quit the nano editor. Type "ls" at the command prompt. Look for the SSH and wpa_supplicant.conf files we created.
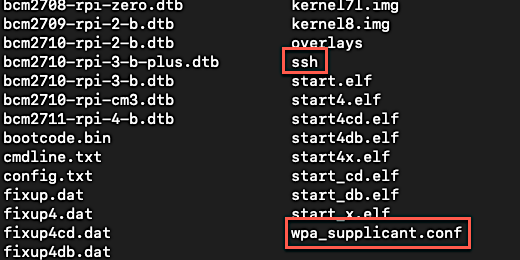
Quit the terminal. Eject the microSD card. Place it to the side for the next lesson.
Windows WiFi configuration
Select the microSD card if it isn't already selected. We are going to create a text file like the one we created for SSH. Right-click in the boot drive and create a new text document.

Name the document "wpa_supplicant.conf". Press the Return key to save the new document name.

Open the file with Notepad. You might have to right-click and select open with Notepad.

We need to insert instructions in the document that will be run when the Raspberry Pi starts. Copy and paste the instructions below.
country=US
ctrl_interface=DIR=/var/run/wpa_supplicant GROUP=netdev
update_config=1
network={
ssid="YOURSSID"
scan_ssid=1
psk="YOURPASSWORD"
key_mgmt=WPA-PSK
}
The first line identifies your country. Change this line to match yours. The second line is used to control the wireless adapter through the wpa_supplicant configuration. The third line updates the configuration. In the remaining lines, we provide the information for the wireless access network. The SSID or Service Set Identifier is the name of your wireless network.
Replace YOURSSID with the name of the wireless network you want to access. Make sure to leave the quotation marks.
Replace "YOURPASSWORD" with the password for the wireless network. Make sure to leave the quotation marks.
The password is case sensitive. Type it exactly or it will fail to connect. A failed connection means we need to manually configure the wifi. To do this we need to connect a display and keyboard to the P. It's messy. Please be careful.
Save the changes to the document and quit Notepad.

Both files need to be in the boot drive. They will be used by Raspbian to configure SSH and connect to the wireless network.
Chromebook configuration
The configuration steps on a Chromebook are the same as those used in Mac and Windows. We are just using a different text editor. Use the text editor extension we installed in the SSH lesson. It should still be open from that lesson. Copy and paste this code into the editor. If you can't copy and paste then make sure you type it correctly.
country=US
ctrl_interface=DIR=/var/run/wpa_supplicant GROUP=netdev
update_config=1
network={
ssid="YOURSSID"
scan_ssid=1
psk="YOURPASSWORD"
key_mgmt=WPA-PSK
}
The first line identifies your country. Change the line to match yours. The second line is used to control the wireless adapter through the wpa_supplicant configuration. The third line updates the configuration for the adapter. In the remaining lines, we provide the information for the wireless access network. The SSID or Service Set Identifier is the name of your wireless network.
Replace YOURSSID with the name of the wireless network you want to access. Make sure to leave the quotation marks.
Replace "YOURPASSWORD" with the password for the wireless network. Make sure to leave the quotation marks.
The password is case sensitive. Type it exactly or it will fail to connect. A failed connection means we need to manually configure the wifi. To do this we need to connect a display and keyboard to the P. It's messy. Please be careful.
Click save as.

Change the name of the file to "wpa_supplicant.conf".
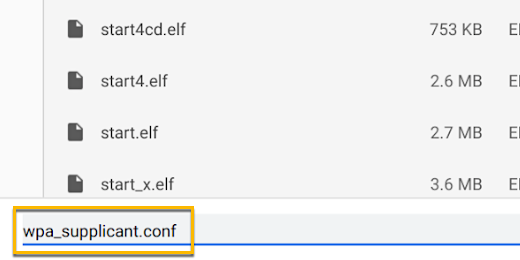
Select the external drive disclosure triangle. This reveals the volumes. Select the boot volume.

Click the save button in the text editor. Close the text editor. Eject the MicroSD card.
Assembling the Raspberry Pi
Before assembling the Raspberry Pi I like to insert the MicroSD card. It is much easier to insert the card when the Pi isn't surrounded by the case. Insert the MicroSD card into the slot on the Raspberry Pi. There is a mechanism inside that holds onto the card. I describe it like a pen that clicks. Push the card into the slot until you feel a slight click. You might need to use your fingernail.

There isn't much to assemble. The kit you ordered should have included a box for the Pi. Most Pi boxes come in three parts. The Pi itself goes onto the base. Place the Pi on the base for now. This will keep the electronic components from coming into contact with anything that might damage them. This is a good time to use the Static Strap if you purchased one.

The base and the Pi are enclosed in a protective case. The third piece is a cover. Don't place the cover on the Pi yet. We need to access the GPIO pins in a future lesson.
Weather Station Project Lesson 1
Weather station project using a Raspberry Pi. The Pi collects information from a temperature and humidity sensor. This lesson describes the project. The needed items for the project are outlined. The MicroSD card is formatted using the command line on MacOS and Windows 10. We also format the drives using Disk Utility, Windows formatting tools, and the Chromebook Recovery Utility. The drive is formatted for the creation of the Raspberry Pi boot image.

Introduction
This project is much longer than some of my other projects. It is also more technical than others. This project is something I always wanted to do in my classroom. It is also something I wanted to provide during professional development. At the time I lacked the resources and time to produce the product. The availability of inexpensive computes and components makes this project possible.
We will develop a basic weather station. The station will collect temperature and humidity information. The information will be published to a Google Sheet. The information in the form of data will be graphed with charts in Sheets. The charts will be published using Google Sheets and Google Sites. This provides live updated information from the temperature and humidity sensor.
The resources for this project are relatively inexpensive. You will need a Raspberry Pi to collect and publish the information. You will need a humidity and temperature sensor. Both sensors are in the module. You will also need a Google account.
We are using a basic computer called a Raspberry Pi. The Raspberry Pi is part of a kit. The temperature and humidity sensor is part of a separate kit. I recommend getting both kits. The kit that includes the sensor offers additional sensors and resources. I plan on creating and publishing a variety of lessons using these kits. Several kits provide similar resources. Here are the ones I recommend. I have links to the kits on Amazon. You don't have to purchase the kits from Amazon. The link is here to reference the actual product. The kits are available from their respective providers for education. Contact them for special pricing options. I have a summary of the kits here.
Raspberry Pi kit - The kit contains all you need to get started. Make sure the kit includes the power adapter, microSD card, microSD card adapter, and a case to enclose the Pi. I have links to these kits on Amazon and the Canakit websites. You don’t have to use the kits from these links. Purchase the Pi anywhere you want. Make sure it has the basic parts of the kit that I outlined above. The image below shows the components in the kit.

Raspberry Pi kit
Canakit website: Raspberry Pi 3+ Starter Kit
Amazon: Raspberry Pi 3 B+ Starter Kit
Arduino Kit - This kit contains another device known as a microcontroller. We are not going to use the microcontroller in this project. I will include it in future projects. The Arduino kit contains items we need for this project and future projects. The kit contains the temperature sensor we need. It also contains wires, resistors, and a breadboard needed for the project. The Arduino kit is usually less than half the price of a Raspberry Pi kit. I use the Starter kit by ELEGOO. I recommend the kit from one of the links below.

Elegoo Arduino Starter Kit
Elegoo: Elegoo Uno Super Project Starter Kit
Amazon: Elegoo Uno Super Project Starter Kit
Raspberry Pi version 1.xx and 2.xx users. If you have an older Raspberry Pi then use it instead of purchasing the latest version. These Pi devices did not include wireless capabilities. You will need wireless access to a network. Wireless access allows you to place the temperature sensor anywhere within the sphere of a wireless access point. You will need to purchase a wireless adapter for the Pi. I use and recommend the Edimax EW-7811Un 150Mbps 11n Wi-Fi USB Adapter. It is available from Amazon. It plugs into one of the USB ports on the Pi.
One item that is not on the list but important. You will need a computer and Internet access. You can use any brand of computer and operating system. I recommend a computer running Windows 10, Mac OS, Linux, or Chrome.
Here is another item I recommend. The sensors and the Raspberry Pi are sensitive to static electricity. There is a grounding strap that is used to reduce the risk of damaging the components. The anti-static wrist strap is available from Amazon. It costs a little over five dollars. A worthwhile investment to safeguard a $150 project.
Raspberry Pi Introduction
In this lesson, we are setting up a Raspberry Pi to run our weather station with a temperature and humidity sensor. I am using a Raspberry Pi version 1.2. I am doing this to make sure everything works if you happen to be using an older Pi. The latest Pi version at the time of this lesson is the Raspberry Pi version 4. This version is much faster than the original. All the versions can do the same things. The newer version is more expensive than the Pi 3. This is why I recommended it for our projects and provided the link for it.
Before we being, I want to go over what a Raspberry Pi is and why we are using it instead of a regular computer. A Raspberry Pi is a small computer. It is about a little larger than a credit card. It has a Processing Unit, processing memory, and storage. It does not come with a monitor, keyboard, or mouse. The lack of a keyboard and mouse may seem like a disadvantage. We will soon see they are not needed.
The processor on a Pi is not as fast as a desktop computer. It isn't even as fast as a basic smartphone. It has minimal RAM, Random Access Memory. The latest version has 1-gigabyte of RAM. In contrast to typical computers which include 8-gigabytes of RAM. Storage on the Pi depends on the size microSD card inserted into the slot. The Pi starter kit includes a 32 GB microSD card. Hum, I think that was the storage capacity of my first laptop in 1997.
Pi is small and underpowered in comparison to most modern computers. All that processing power, memory, and storage aren't needed for our projects. This device is not meant to replace your laptop or desktop. Its purpose is to help hobbyists and developers use an inexpensive platform to develop projects. It is often used to prototype much larger products.
The Raspberry Pi is a wonderful device to learn fundamental and advanced computer skills. With a Pi, we can build a web server to host a website. We can build a media center for audio and movies. We can attach electronics and sensors to monitor the environment. We can build on our home webcam. The list goes on and on.
The image of the Raspberry Pi on the page is from a Pi version 3. All the devices are very similar. There hasn't been much of a change physically from the first Pi. The original Pi included 26 GPIO pins. Version 1.2 and later included 40 pins. I'll explain GPIO pins later. Here is a basic overview.

It has four USB ports. These are used to connect devices like a keyboard, mouse, and USB drive.
It has one Ethernet port. This is used to connect the Pi to a network drop or router. Raspberry Pi 3 and 4 include WiFi and Bluetooth.
It has an HDMI port to connect to a display or television. An HDMI port transmits high-quality video and audio from the same port along one cable.
One Micro SD card slot. The micro SD card holds the operating system for the Pi. It is also the default storage location.
One Micro USB power input. The Micro USB port is used to supply power. The power can come from any source that provides 5-volts. This is typically a computer USB port, cell phone wall plug, or power adapter. Your kit came with a power adapter. Make sure to use this adapter. It provides the best performance and won't damaging your Pi.
One 3.5 mm 4-pole composite video and audio port. This is typically used for audio out or to connect a composite cable for devices without HDMI.
One CSI camera port. This port is used to connect an external camera. This camera is similar to the camera on a laptop.
One DSI display port. This port is used to connect to external LED displays. These displays are typically about the size of a small tablet. Some of them offer touch screen options.
40-pin GPIO connectors. This is the key to why we are using the Raspberry Pi. The acronym GPIO stands for General Purpose Input and Output. These pins will connect to our temperature and humidity sensor. They will supply power to the sensor and receive data from the sensor.
The large square chip in the middle is the Broadcom CPU. This is the brains of the Pi. The specifications for the Raspberry Pi 3 B+ are listed below.
Raspberry Pi 3 Model B+ (B Plus) with 1.4GHz 64-bit quad-core ARMv8 CPU (BCM2837B0)
1 GB LPDDR2 SDRAM
Dual-Band 2.4GHz and 5GHz IEEE 802.11.b/g/n/ac Wireless LAN, Enhanced Ethernet Performance
Installing the Operating System
The Raspberry Pi should have been shipped with a Micro SD card. The typical size of this card is 16 or 32 Gigabytes. Either size is more than adequate for the project. The Micro SD card includes an SD adapter. This adapter is there to insert the SD adapter into a computer with an SD card reader. Many computers come with an SD card slot. The Raspberry Pi kit includes a Micro SD USB adapter. It looks like a small flash drive. The micro SD card plugs into the device. The device then plugs into one of your USB ports. This is a USB port on your computer. The microSD card connects to the microSD card slot on the Pi. We need a regular computer to set up the card for use on the Raspberry Pi.
The microSD card includes all the tools you need to get started with the Raspberry Pi. It includes NOOBS. NOOBS is someone new at something. Like a newbie. The tools on NOOBS are wonderful. Most of them are not needed for our project. The NOOBS installation includes the full Raspbian operating system. We are going to install a lite version of Raspbian. Here is the link to the official Raspbian page, raspbian.org. There is thorough documentation on the site if you are interested.
Formatting the microSD card
Doing this step is useful for one fundamental reason. You are going to need to know how to do this at some point. MicroSD cards can fail. Operating systems become corrupt. Systems often crash. Knowing how to reinstall the operating system is crucial in these situations.
I will walk you through the process in complete detail. As always, I assume you don’t have any experience with any of the technology we are using. Feel free to skip the steps you already know. Don’t fail to perform them because they are crucial to the successful operation of our project.
Insert the micro SD card into the adapter that came with your kit. Insert the SD card adapter into your computer. This next step is not necessary but I like to go over the process. We are going to format the micro SD card. I like to do this so you know how to format the card if it becomes necessary. The card is in constant use and it doesn't take much to corrupt the contents of the card. It has happened to me on more than one occasion. Formatting assures we are installing the operating system on a reliable card. The process for formatting the card depends on your computer's operating system. I will go over the process using Windows 10, macOS, and Google Chrome for Chromebook.
The MicroSD card is formatted using the MS-DOS FAT 32 format. FAT stands for File Allocation Table. MS-DOS stands for MicroSoft Disk Operating System.
The terminal
This is the part that might scare some people. We are going to use the command line for almost all of the remaining lessons. With the command line, we don't use the mouse. We don't have a graphical user interface. The terminal is an application that provides access to the command line. The command line is where we enter instructions with the keyboard. The mouse isn't used so there is nothing to click. The command-line instructions are all available in this lesson. You can copy and paste them to avoid making mistakes. I encourage you to type them out on your own.
I will cover how to format drives using the regular formatting tools in Windows and macOS. This is for those not sure about jumping into the command line right away.
Formatting on Mac
To use the command line on Mac we need to open the Terminal application. The application is in the Utilities folder. The Utilities folder is inside the Applications folder. Open the Utilities folder and look for the Terminal application. Launch the Terminal. The Utilities folder contains the Disk Utility too. We will use this later to format the same drive. This is for those of you unwilling to try the command line yet.

A window opens with some text. The name of your user account on the computer appears to the left of the command prompt. The command prompt is the percent symbol. The blinking square next to the prompt is the cursor. The tilde next to the percent symbol indicates you are in the account’s home directory.

Okay, let's issue a terminal command. We want a list of the contents of our home directory. Type 'ls' and press the Return key. You will get a list of the folders and files in the home directory. Some of the names you might recognize as folders. These include the Desktop, Documents, and Movies folders. Folders are directories on a computer.

Type 'ls -l' and press the Return key. The "-l" after the "ls" command is an option. The "-l" instructs the list command to provide additional information. It shows file or directory, size, modified date and time among other things.

There is a pattern of letters on the left side of the list. The first letter indicates if the item is a directory or folder. All the items in this list are directories except for humidity.py. This is a file. Type "clear" and press Return.

Clear erases the contents of the terminal window. How’s it going. Not hard, Right?!

It is important to properly identify the micro SD card. I recommend you disconnect and remove any non-essential storage devices from your computer for this step. This includes any external hard drives. I have accidentally formatted external drives myself. Do yourself a favor. Disconnect any external drive.
Type diskutil list and press the return key.
A list of any attached drives will be generated. The micro SD card we inserted will be shown with its storage capacity. The card I am using is a 16 GB card. It appears on the list as 15.9 GB. The card will have one of two possible names. It might be titled BOOT or untitled. The card is formatted using the FAT32 format. The computer drive on Mac is typically formatted using the APFS format. These are additional clues to identify the card on your machine.
There is some important information related to the micro SD card that we need before formatting. The device has what is called an identity. The identity number is shown on the left. The device identity for my card is “disk2”. The device identity on your drive might be different. Make a note of the disk identity and jot it down somewhere. You are going to need is soon.

The command instructions for formatting our micro SD card are as follows, “diskutil eraseDisk FAT32 BOOT /dev/disk2”. Press the Return key to execute the command. Don’t include the quotation marks if you are copying and pasting. Replace my disk identity with yours.

Here is what the instructions represent. We call the diskutil application to erase a disk. The disk will be formatted with the FAT32 file system. The disk name will be BOOT. The disk name needs to be in All Caps when using the FAT32 file system. The location of the disk to be formatted is in the dev directory. The identifier of the drive is disk2.
A formatting progress bar appears. The formatting process doesn’t take long. It usually takes a few seconds. If you didn’t see the formatting progress bar then go back and check the commands. You might have made a mistake in the spelling. You might have omitted one of the instructions. Always check your instructions before pressing the Return key.

When the process is complete you will see some messages. One of the lines will read "Finished erase on disk". The disk identifier will match your micros SD card.

The formatted disk will not appear on your desktop. The disk is unmounted after formatting. This means the disk volume is ejected. To see the drive you will need to unplug the drive and plug it back into the computer. Unplug the drive and put it aside for the next lesson.
Formatting on Windows
Formatting external devices on Windows has changed over the years as the Windows operating system evolves. These instructions cover Windows 10. Insert the micro SD card and adapter into one of the USB ports on your computer. Click in the search box on the Task Bar and type CMD for Command.
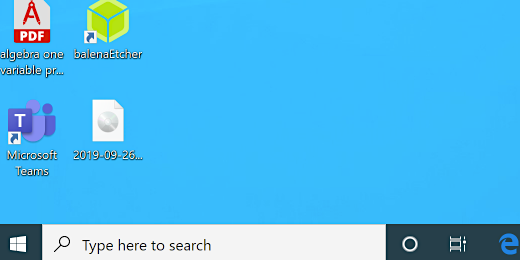
The Command option takes us into the command prompt. We want to run the Command Prompt as an administrator. Click the Run as administrator option.
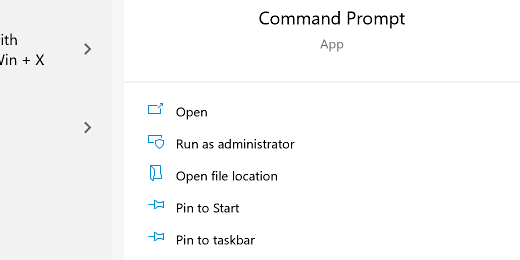
You might be asked to allow the Command Prompt to make changes on the device. Click the Yes button.

A Command Prompt window opens. This looks similar to the Terminal on MacOS.

Type the command diskpart and press the Return key.
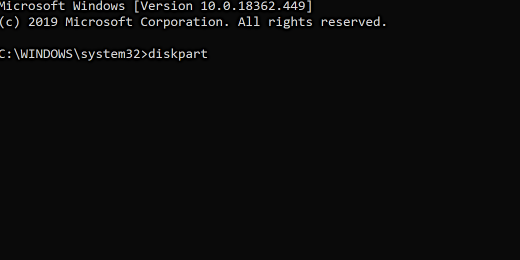
Diskpart is a command tool used to manage drives on the computer. The Windows Command Prompt is replaced by the DISKPART prompt.

Type list volume and press the Return key. Drive volumes attached to the computer will be listed. I recommend you remove or disconnect any external drives. This reduces the chance that you might select the wrong drive.

Looking at the list we see several volumes. Each volume has a letter and label. There is a column with the file system used for each drive. We want to look for a drive that has the FAT32 file system. Windows uses the NTFS file system for its main drive and larger drives. We see that the drive with the FAT32 file system is removable. The size column shows that the drive is close to matching the size of our micro SD card. My card has a storage capacity of 16GB. The column shows 14GB. The sizes of the other drives are in no way close to matching this size. The micro SD card on my computer is assigned Volume 4. Make a note of the volume number for your SD card. Type select volume followed by the volume number for your micro SD card.

Look for a message confirming you selected the appropriate volume.
Type the command below and press Return. The card is formatted with the FAT32 file system and labeled BOOT.
Diskpart> format fs=FAT32 label=“BOOT” quick

A completed message appears at the end of the process. Remove the adapter and microSD card. Set it aside for the next lesson.
Formatting with Disk Utility
Eject and remove any external storage devices except the microSD card. Open the applications folder and then the utilities folder. Look for the Disk Utility application. Open the application. Look for an external drive. The drive will probably be titled BOOT. Click once on the drive.

Here are ways to verify you have the correct drive selected. The drive is formatted as MS-DOS FAT32. Verify the storage capacity with the card you are using. The kit includes a 32GB SD card.

Click the Erase button. Click the format selector. Select MS-DOS (FAT). Click the Erase button.

The erase process doesn’t take long at all. Click the Done button to finish. Eject the SD card and put it away for the next lesson.
Formatting on Windows
Insert the SD card into one of the USB ports on your computer. Open the File Explorer.
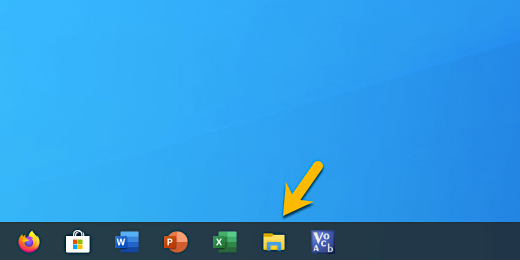
Look for the drive with the name BOOT. Click on the drive.

Click the Drive Tools tab. Select Format.
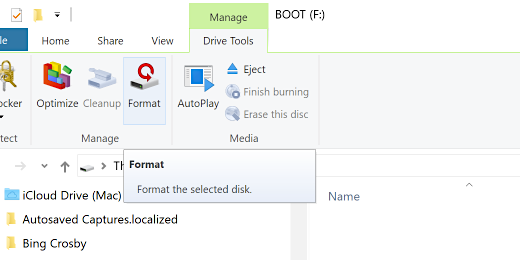
Click the File system selector. Chose the FAT32 format. Click the Start button.

Eject the SD card and put it away until the next lesson.
Formatting on Chromebook
The Chromebook is different from your typical computer that runs and OS like Mac or Windows. The Chromebook runs a version of Linux. Linux is a free open-source operating system. The operating system is based on Chromium OS. The MicroSD card is preinstalled with another Linux version based on Debian. This matters when we need to format the microSD card.
Typical drives like flash drives and microSD cards are easy to format. The card that came with your kit comes with Linux preinstalled. The card is specially formatted and partitioned into volumes. You will see what I mean in a moment. To format the drive we will use a recovery tool. This tool will be used later to create our boot media for the Raspberry Pi.
The Chromebook recovery tool is available in the Google Chrome store. Go to the Web Store by clicking the icon.

Search for the Chromebook recovery utility.

Add the utility by clicking the Add to Chrome button. Confirm the installation when you receive the message.

Find the utility in the Chromebook launcher and open it. Insert the microSD card with the USB adapter. Click the gear icon in the recovery utility. Select the option to erase recovery media.

Select the microSD card when prompted to select the recovery media. The SD card should be the only device that appears. Click the Continue button.

Click the Erase button to confirm. The process doesn’t take long. A second or two. A message appears to confirm the process is complete. Click the done button. Close the utility. Unplug the MicroSD card and set it aside for the next lesson.
There are times when an error message appears. Try the reformat process again if this happens. If it continues to happen you will need to use a different microSD card.
Why the Recovery Utility?
Normally we don't need the recovery utility to format an external drive. It made sense in this case. The formatting of the microSD card that came with your kit is different. Let's take a look. The formatting of external drives takes place in the Files utility.

The connected microSD card looks like this when inserted.
It typically looks like this.

The external drive in our media is partitioned into two volumes. Google does not have an option to configure partitions. We want to remove the partitions and have one for our system. The recovery utility allows us to format the device and remove the partitions that exist.
Tinkercad Transistor circuits
Transistors and LEDs have revolutionized our modern world. Transistors have made fast and small computers possible. In this lesson, we will learn to use the transistor as a switch.

Transistors
Transistors and LEDs have revolutionized our modern world. Transistors have made fast and small computers possible. In this lesson, we will learn to use the transistor as a switch.
Transistors have three leads. Each lead has a name and a purpose. The center lead is called the Base. The leads on either side are called the Collector and Emitter. You will see an image of this transistor later in the lesson. The location of the emitter and collector depend on the type of transistor being used. There are two types of transistors. Each transistor is referred to as either a PNP or NPN transistor.
The difference in the type of transistor depends on how it is manufactured. The NPN transistor is the most popular and common. Each end of the transistor is made of a semiconductor material that is saturated with electrons. The center material is depleted of electrons. This positively charged layer is sandwiched between two negatively charged layers. This is the transistor we will use in our lesson.
The PNP transistor is not as common. This transistor has a negatively charged layer sandwiched between two positively charged semiconductors.
For the transistor to work as a switch the base must receive electric current. The current stimulates the base to allow the flow of current across the collector and emitter. We typically have two power sources for a circuit with transistors. One power source activates the base and another source powers a component. Our first project will have one power source. The first project will help us compare how the second project with two power sources differs and the advantages of having two power sources.
Switches
For this project, we will need a breadboard, LED, resistors, button, and transistor. Create a new project. Place a small breadboard onto the work area. The first step is familiar. Attach a resistor to the board. One end connects to the positive rail. Add the LED so the Anode is on the same connection as the resistor. The current must flow into the LED through the Anode lead.
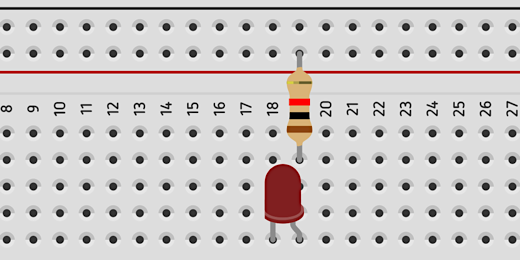
This circuit is going to have a few more components than our other circuits. I want to have plenty of room to keep things easy to see. Move the LED to the other half of the breadboard. Place it on the bottom of the board.

Use a jumper wire to connect the resistor to the Anode on the LED.

Get a 9-volt battery and attach jumper wires to the top half of the board.

We are using the lower half of the board too. Run jumper wires from each rail in the top half of the board to the lower half.
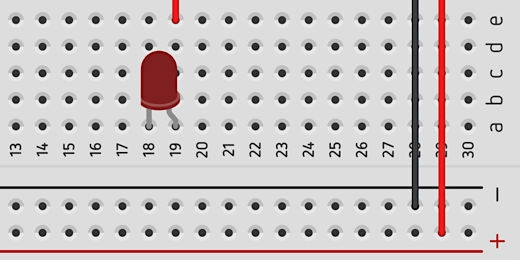
In the LED circuit, we placed a push-button between the Cathode and the negative rail. We are going to do the same thing here but we will use a transistor as our button to close the circuit. Find an NPN transistor in the components panel. It’s in the basic set of components.

Place the transistor in the top half of the board next to the resistor. A transistor has three parts. It has a collector, base, and emitter. The transistor on our board has the letters C, B, and E to help identify the parts.
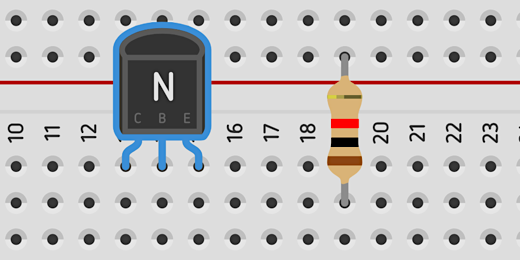
Connect a jumper wire from the Cathode on the LED to the Collector on the transistor. The Collector is labeled with the letter C.

Circuits run in loops. To complete the loop in this circuit we need to connect a jumper wire from the emitter to the negative rail. The transistor is large like the capacitor in our previous lesson. Instead of moving the transistor to attach a jumper wire we will attach it to the bottom of the board.
We don’t have a complete connection yet. Press the Start Simulation button. The LED doesn’t light because we don’t have a closed circuit. We need to pass current into the base of the LED to close the circuit.
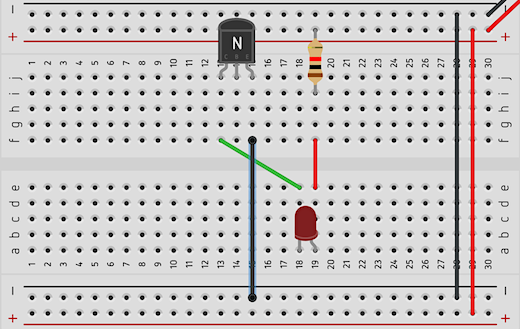
Let’s take a moment to see how this circuit resembles a previous circuit. If we replace the transistor with a switch it looks like one in a previous lesson.
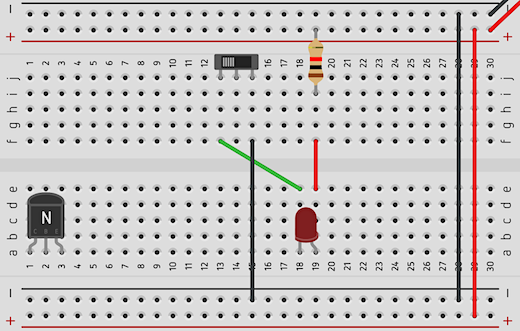
This is the part that makes it all work. Connect a resistor to the base of the transistor. The resistor will connect with the lower half of the board. Connect a jumper wire from the other end of the resistor to the positive rail. The current running from the positive rail through the resistor and base of the transistor is what activates the transistor.

Press the Play Simulator button. The LED will light.

The current flowing into the base of the transistor is what causes the transistor to close the circuit.
At this point we have a discussion noting the similarities and differences between a transistor, push-button, and switch. We discuss how the transistor is like a push-button and how it is like a switch.
Students have discussions in small groups. They discuss when a transistor as a switch would serve better over a regular switch. What are the advantages and disadvantages of using a transistor as a switch in a simple circuit?
Title the circuit Basic Transistor circuit and click the Tinkercad icon to return to the Tinkercad Circuits page.
This basic transistor circuit uses one power source to activate the transistor and light the LED. Let’s take a look at a circuit where we use a smaller current to pass a larger current to a circuit.
Amplification
The circuit for this lesson is similar to the one in the previous lesson. We don’t need to recreate the whole project. We will be using many of the same components.
We’ll make a copy of the previous circuit and use it for the next. Hover your mouse over the circuit preview of the previous project. Click the gear icon that appears in the upper right corner.

Select the Duplicate option.

A copy of the circuit will be created and opened. The first thing we are going to do is replace the 9-volt battery with a AA battery. Click once on the 9-volt battery and press the delete key on your keyboard. Find a 1.5 volt AA battery and place it next to the board.
The terminals on the battery are at a right angle to those on the breadboard. I like to rotate the battery so the terminals are parallel.

There is a rotate button in the button bar next to the trashcan icon. Clicking the button will rotate a component clockwise. Make sure the AA battery is selected and click the rotate button once or twice. We need to do a lot of clicking to rotate the battery in this direction. Hold the Shifty key on your keyboard when clicking the rotate button to rotate counter-clockwise.
Connect the terminals to the board with jumper wires. The terminals don’t align so the wires will cross. This is where color-coding helps.

We reduced the voltage of the battery. In doing so we reduced the amount of current going to the circuit. Press the Start Simulation button to see the result on the LED. The light from the LED is fainter.

Stop the simulation and get another 1.5 volt AA battery. Place this battery on the opposite side of the board. Rotate the battery. Connect one jumper wire to the negative rail at the top of the board. Connect another jumper wire to the positive rail at the bottom of the board. This battery will serve as the source for the Base of the transistor. It will trigger the switch to allow current to flow through the transistor and circuit.
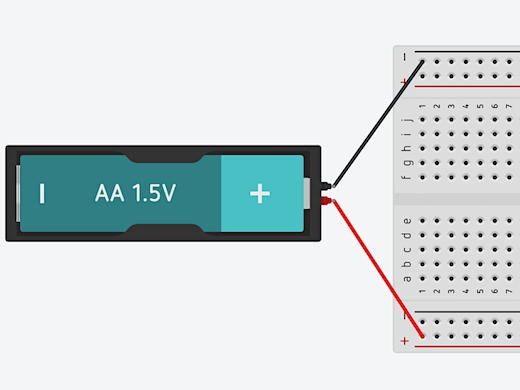
This battery provides the power source for the transistor base. We don’t need the power from the other battery yet. Remove the jumper wire connecting the battery on the right side of the board. Leave the wire for the negative connection. We still need a ground connection for the emitter.

We want the LED to shine brighter so we need more current. To get more current we need more potential energy in the form of volts. Click once on the 1.5 volt AA battery on the right side of the board. The configuration panel for the battery shows a count of one battery.
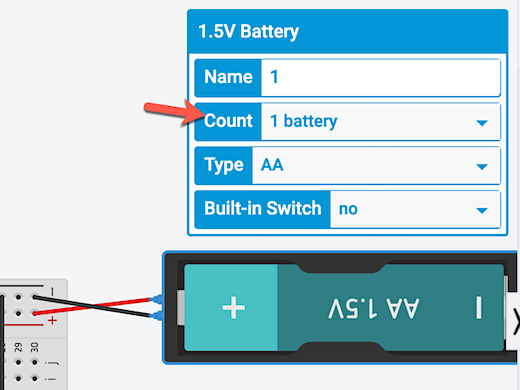
Click the battery count selector and choose 4 batteries.

Click the Start Simulation button. The LED is much brighter now.

Click once on the battery on the left side. Go to the configuration panel for the battery. Change the built-in switch option from No to Yes.

The battery will be enclosed in a case with an ON/OFF switch. Click once on the switch to turn the battery current OFF. This battery supplies current to the transistor. When current from this battery stops, the current to the transistor stops. This opens the circuit and prevents the current from batteries on the other side. No current means our LED won’t shine.

Circuits with Capacitors in Tinkercad
A capacitor is much like a battery. It stores current and releases that current when a circuit is closed. They don’t store as much current as a battery. Capacitors are reliable and don’t need to be replaced like batteries.

Capacitors
We will build on the skills we learned in the LED circuit. This circuit uses a capacitor. A capacitor stores current and releases it at a steady rate. The current in a circuit can change with power fluctuations, which can damage sensitive circuits. Capacitors are used to smooth out the current supplied to components and gradually reduce the current supplied to a component.
A capacitor is similar to a battery. It stores current and releases it when a circuit is closed. However, unlike batteries, capacitors don’t store as much current. Nevertheless, they are reliable and don’t need to be replaced like batteries.
This is an excellent time to discuss potential energy and kinetic energy. Batteries and capacitors store electricity, which is potential energy. The stored energy is released into circuits and provides kinetic energy. The amount of kinetic energy released is measured as current. The potential energy in batteries is measured in volts.
The potential energy in capacitors is measured in Farads. Capacitors store electrostatic charge. They don’t produce the current released. They store it and release it at a steady rate.
This resource has been relocated; use the link below.
Buttons and switches in Tinkercad circuit projects
Buttons and switches are used to complete circuits in electronic components. Tindercad has buttons and switches to close circuits in our simulated electronic projects.

Buttons in an LED circuit
A switch or button is used to close a circuit. Current in a circuit flows from the positive side of a power source to the negative side. A closed-circuit is required to enable the flow of electrons from the positive side of the battery terminal to the negative side.
We’re going to build on the same circuit from the previous article, A Basic LED Circuit with Tinkercad.
Go to the Components panel and look for the push button. It has a circle in the center of a square. Place the push button on the right of the LED. We will use the button to bridge the center division of the breadboard. Half of the button should be on one side and the other half on the other.
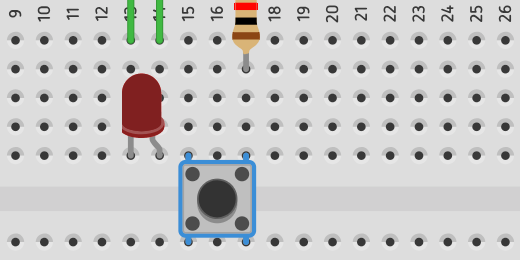
We need to move our components around the board to complete the circuit. Move the LED so the Anode lead is on the same row as the lead for the left side of the switch.
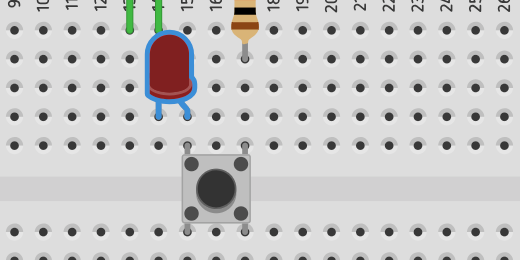
Move the resistor to the other side of the board. Align the resistor to the right lead of the push button. One end of the resistor needs to connect to the positive rail on the board.

We need to reposition the two jumper wires. The jumper wire that connects to the LED Cathode lead needs to connect to the negative rail.

Click once on the jumper wire. Circle handles appear at each end of the wire. Use the handle on the positive rail to move the end of the wire to the negative rail.
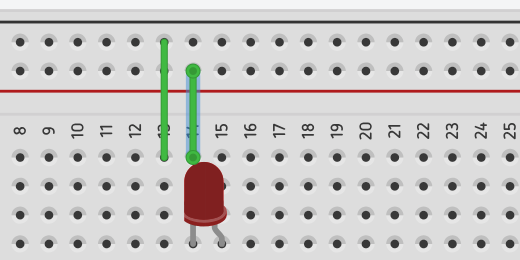
Click once on the jumper wire to the left of the one we positioned. Click and drag the top of the wire to the right.

Place the wire near the jumper wires for the battery. Connect it to the positive side of the rail.

Move the other end of the wire to the other side of the board and connect it to the positive rail too. This is how we distribute current to both sides of the board when using one battery.

jumper wire across breadboard
Let’s take a closer look at the push-button connection. Think of the button like a road with two lanes. Current flowing in each lane will flow uninterrupted. The current flowing through the right lead is not prevented from flowing through the button. The current cannot go to the other lead, the one on the left, unless the button is pressed. Pushing the button closes the circuit and current flows from the right lead to the left lead. Like a car changing lanes.

Press the Start Simulation button. Press the push button with your mouse to light the LED. Keep the button pressed on your mouse to keep the LED light. Release the button to turn OFF the LED. The LED remains light as long as we keep pressing the button.
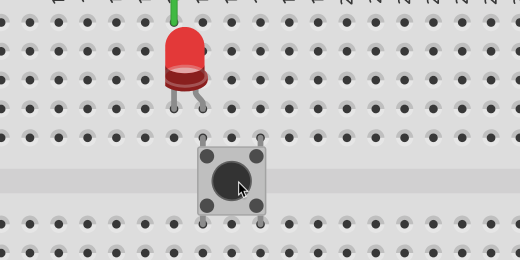
Using A Switch
A switch is an option to light the LED without keeping our finger or the arrow on the push button. We’ll replace the push button with a switch. Click once on the push button and press the delete key on your keyboard. If the button isn’t removed, make sure the simulator is stopped. Go to the Components panel and find the switch.
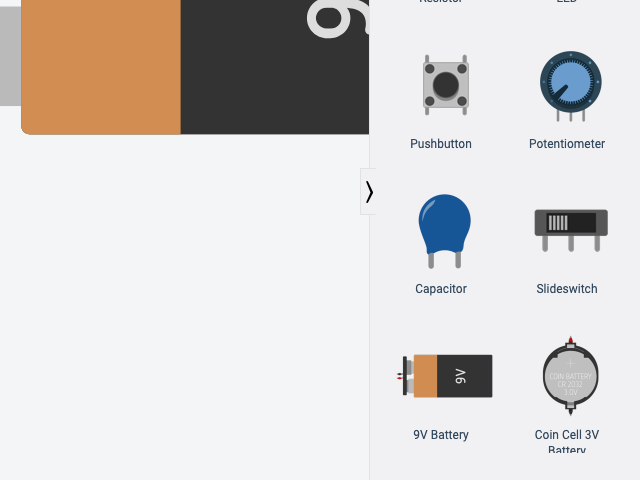
Place the switch on the board. Place the center lead of the switch in the same row as the resistor. Place it in the column above the resistor.
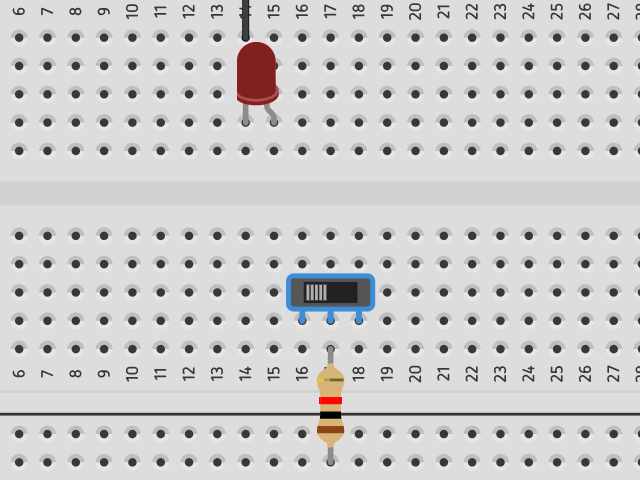
The center lead on the switch is called the Common. This is where the current flows into the switch.

The leads on either side of the switch are called terminals. The lead on the left is called Terminal 1. The one on the right is called Terminal 2.

Connect a jumper cable from Terminal 1 to the Anode on the LED.

There is a slider on the switch. The slider is currently connecting the Main to Terminal 1. This is creating a closed circuit. Click the Start Simulation button. The circuit is closed and the LED will light.

Slide the switch to the right to turn the LED OFF.
Basic LED Circuit with TinkerCAD
TinkerCAD has a circuit development environment along with a simulator. The components are similar to actual components. This allows us to teach basic electricity and electronics concepts.

Introducing Tinkercad
Tinkercad is an online development tool for 3D models. It is also a development tool for electronic circuits. The development environment is easier to use than similar tools used by professionals. It’s intuitive for students. The lessons in this article will focus on the electronic circuit development environment. This environment has components to construct a variety of electronic circuits. We assemble and test these circuits inside the development environment.
There are many benefits to using an online development and simulation environment. The service is online so there is nothing to install. There is no specific browser requirement. The service is free. The components don’t break. We are free to make mistakes. The environment is safe. We don’t have to worry about students sticking themselves with the points of LEDs or transistors. No electronic shock from battery current.
A drawback is that the development and testing environment is digital. Studies have shown time and again the importance of kinesthetics. Kinesthetic learning is where students interact with their learning by touching and interacting with objects. Students are engaged in active learning.
In my experience, students learn better when they interact with the content. Using an online simulation is not enough. The online skills don’t always transfer from the simulated world to the real world. There are lots of reasons for this and one reason is the lack of context. Learned skills must be applied to real-world situations.
I recommend combining the online development of circuits with hands-on activities using real components and circuits. Electronic circuits are relatively inexpensive. A box of 300 LEDs on Amazon costs as little as $9 US dollars. A box of over 500 resistors costs about the same. An assortment of capacitors costs about 13 dollars. A pack of six mini breadboards runs about $5. Keep in mind that these are all reusable and can last years.
Find an old radio in a second-hand store and open the back. Expose the electric components. Don’t plug the radio to a power source when doing this. Remove any batteries too. Identify the components and discuss their purpose.
Studying the components in a circuit ties in very nicely when discussing systems. How do the components contribute to the functioning of the radio? How would the removal of one component affection the functions of the radio? How is this similar to other systems?
Login to the Tinkercad Circuit Environment

Tinkercad is free. Creating an account requires an email address. Students in districts with account integration through Google or Microsoft can log in with one of these accounts. The login option for Google or Microsoft is not immediately apparent. Let’s take a look at the process. Click the Sign In button.

Select the option to sign in with a social media provider account.

Select the Google or Microsoft login option.

Sign in with your email account credentials. If you are using a Google account and the Chrome browser then you will be presented with your account information. Click the account you want to use. Most people have one account. You might have multiple Google accounts. Just select your favorite.

The Tinkercad home page appears as soon as you log in. The home page begins with the 3D development environment. There is a menu on the left side of the page. Use this menu to navigate to the Circuits development environment.

The Circuits portal has a nice big green button. Click this button to create a new circuit.

The Circuit Simulator

The circuit simulator is simple. The main area has a development canvas. All the available components are found in a panel on the right side. There is an extensive list of components. The basic components are displayed for us to create basic projects. Some of these components include LEDs, switches, resistors, and batteries. There is a search box above the component list. The search box is useful when we need to find a specific component in the much larger list of components.
There are four buttons above the list of components. One of the buttons is used to start the simulation after we construct a circuit. When everything is ready we press the Start Simulator button. This activates the simulated battery current. We need to press this button to begin the simulation every time. We need to stop the simulation when we want to make any changes to the circuit. Like in real life, we should not work on a circuit when current is flowing through it.
The Breadboard
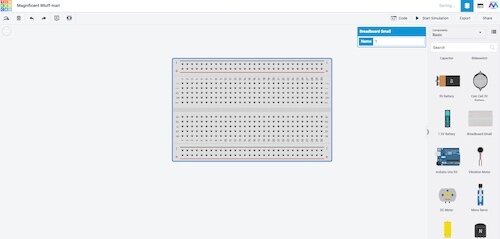
A breadboard is used to develop circuit prototypes. It provides a place for us to connect components and hold them in place. Without a breadboard, we would have to connect components with clips or bare wire. These are not ideal ways to connect components. The breadboard makes the job of creating circuits much easier.
The term breadboard comes from the early days of electronics and prototype development. Hobbyists would use screws and nails on old breadboards to hold components and wires in place. Breadboards were made of wood. The breadboards used for electronic prototyping today are made from a plastic case. Inside the case, we have metal clips that hold components and wires.
For those of you that don’t know. A breadboard was at one time used to slice bread. This is when you made your bread or purchased bread at a bakery.
Before building projects on a breadboard we should find it in the components panel and place it on the work area. Scroll down the list of components and find the small breadboard. Click and drag the board onto the work area. We can also click the board once and it will attach itself to our mouse pointer. Place the board near the center of the work area.

Let’s take a closer look at the board. We must understand how the board works. The board is a plastic rectangular box. The box has holes placed in patterns.

There is a series of holes between red and black lines. These holes are on opposite ends of the breadboard. The end of each line has a Plus or Minus symbol. The plus is red and the minus is black. These colors are important. They are a standard used by most circuit designs. The holes along the red line carry current from the positive side of a battery terminal. The holes along the black line carry current from the negative side of the battery terminal.
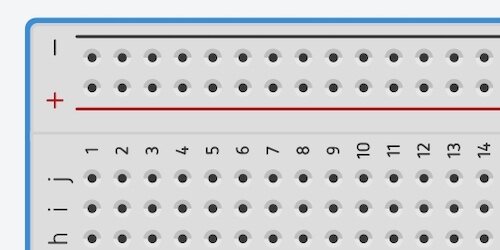
Let’s take a look at what is going on inside a breadboard. Under each of the holes is a metal clamp. This clamp holds the wires we insert into the holes. The clamps are all connected. We can use any hole to pass current to any of the components. In the diagram, I am showing that voltage is flowing in from the positive terminal. The current can flow in from any of the holes on the board. The current is distributed to all the other clamps. Once we connect a component, the current flows up the clamp and into that component.
We are accustomed to thinking that electric current flows from the positive terminal of a battery to the negative terminal. Electric current does flow from the positive terminal to the negative but the concept is backward. Electrons flow through circuits. Electrons have a negative charge. Electrons flow toward the positive end of the battery.
When electric current was first discovered it was thought that electric current had a positive charge. We later found that an electric current has a negative charge. By that time it was too late and the symbols for current flow have remained the same for most people. The positive battery terminal is filled will electrons flowing out and going to the negative end of the battery which is filled with protons. Protons have a positive charge.
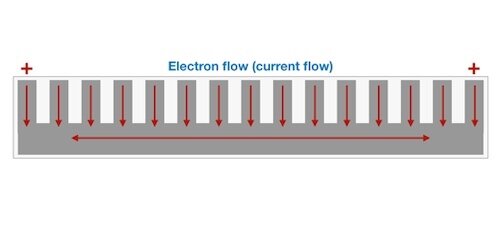
Here is another sliced look at the breadboard. This view shows the positive and negative buses on both sides. A bus in electronics terms is a metal conductor that transfers electric current to components. Each positive and negative connector is a bus that transfers current to each component that touches any point on the bus.
The holes and clips between these two rails work much the same way. The difference is that the clips connect horizontally. The holes in the center are organized in a grid. The columns are labeled from A to J. The rows are numbered from 1 to 30 on this board. This is a small breadboard.
There is a divider running down the middle. This divider is there so we can assemble multiple projects on one board. We can assemble a project using columns A through E and anther using columns F through J. We can bridge this gap using a jumper wire. We will talk about jumper wires once we begin working on the first project.

The best way to learn how a breadboard works is by using it to develop projects.
Basic LED Circuit
The basic LED circuit is my favorite when introducing circuit projects to teachers and students. It provides a good introduction to the basic layout and components in Tinkercad. The circuit is simple and familiar to most people. I used to make flashlights when I was a child.
Basic and advanced components are located in the right panel. Some of the basic components include LEDs, switches, batteries, and resistors. They form the basis of a simple LED light switch. LED stands for Light Emitting Diode. A diode is a component that permits current to flow in only one direction. Current flowing through an LED emits light.
The LED is one of the first components in the list. Click the LED component once. It will attach itself to the mouse pointer.

Move the mouse pointer and LED over the breadboard. The Leads on the LED will want to attach themselves to the holes in the breadboard. Place the LED near the center divider. Don’t worry about placing the LED in the same location like the one shown in my image. There isn’t anything magical about the location where I placed the LED.

Leads on a component are the wires used to connect to other components. Leads in our components will attach to the breadboard rails.
The difference between an LED and a light bulb is important. The differences provide a good opportunity to teach a few concepts. A light bulb uses a filament to generate light. Light is emitted when the filament heats up. It heats up because of current going through the filament. The filament is made of impure metal. This impurity facilitates the flow of electrons and the resistance of electrons at the same time. There is enough resistance to cause heat and light but not so much as to prevent current from flowing through the bulb. It is the resistance that causes the filament to heat up. The heat generated causes the filament to glow. The glow is what provides the visible light we see.
An LED is different from a light bulb because it does not use a filament. It does not rely on resistance to generate light. It uses a semiconductor to facilitate the flow of current. The semiconductor consists of two materials. One is called a P-type semiconductor and the other is an N-type semiconductor. Sorry, we got real technical real fast. It’s okay the purpose is not to understand LED here.
They are assembled inside the plastic container. Electrons flow through the negative side of the LED and excite the electrons on the N-type conductor. The negative conductor. These electrons flow across to the other side with the P-type conductor. The positive conductor. There are holes in the P-type connector where the electrons are forced to flow. The holes are smaller than the electrons. To go through these holes the electrons must lose energy. This energy is given off in the form of photons. Light is composed of photons.
Light bulbs use resistance to generate heat and light. LEDs don’t use resistance. This is why they are cooler than light bulbs and use less energy.
The Resistor
LEDs don’t use lots of energy. They also don’t have much resistance. The typical LEDs we use in a project like this one are sensitive to too much current flowing through them. We need to control the amount of current flowing through an LED. To control the flow of current we need to use a resistor. Select the resistor component and move it onto the breadboard.
The placement of the resistor is important. The LED has two Leads. One of the Leads is bent. This lead is called the Anode. The other Lead is called the Cathode. We send current through the LED into the Anode. This is where we connect the positive battery terminal.
Real physical LEDs don’t have bent leads. The Anode lead on an actual LED is longer than the Cathode.
An LED is a diode and diodes allow the flow of current in only one direction. This direction is from the Anode to the Cathode.
Place the resistor so it lines up with the row that has the Anode on the LED. The other end of the resistor will connect to the positive connector. Current will flow from the positive clips into the resistor. The flow of current is reduced in the resistor and the reduced current flows out the other end. It goes into the clip in the row and into the Anode end of the LED. The current will flow through the LED and exit the LED through the Cathode.

The image below uses arrows to demonstrate the flow of current.

Jumper Wires
To complete the circuit we need to connect the Cathode end of the resistor to the negative side of our breadboard. To do that we need a jumper wire. A jumper wire is used to bridge connections and gaps in our project. Move your mouse pointer over the row where the Cathode of the LED rests. The hole where our pointer is resting is highlighted with a red square. The other holes are highlighted with green circles.

Click once on the hole in the row with the Cathode and drag the mouse pointer toward the negative terminal rail. A green line follows our mouse pointer. Click once on the negative rail to anchor the other end of the lead wire. Don’t click again anywhere because this will cause another lead wire to be created. Press the ESC key on our keyboard to cancel if this happens.

We have all the elements in place for our basic LED circuit. We need a battery to supply the current.

The battery
Go to the Components panel, find a battery and place it next to the breadboard. There are three battery options available. Most students chose either the 9-volt battery or the Double-A battery. I recommend using the 9-volt battery.

It’s easy to remove components from the work area. Click once on the component and press the delete key on your keyboard. You can also click the trash can icon in the button bar.
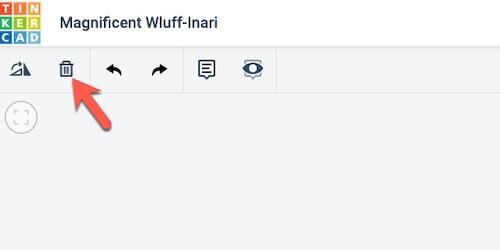
Attach a jumper wire from the negative rail on the breadboard to the negative end of the battery terminal.

Repeat the process with the positive end of the battery terminal.
Start the simulator

The circuit is complete. To light the LED we need to start the simulation. Click the Start Simulation button.

The LED will glow in our simulated circuit. Stop the simulation by clicking the Start Simulation button again.
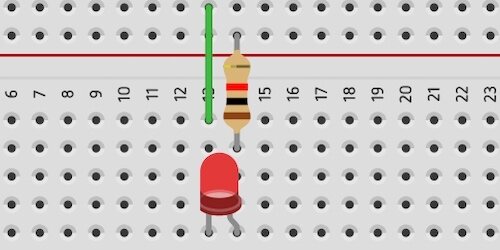
What happens without the resistor?
One of the benefits of working with the simulation is that we can make mistakes. Mistakes provide learning opportunities. We used a resistor to limit the flow of current into the LED. Without the resistor, the LED would burn out and possibly blow. I have seen actual LEDs give off smoke from too much current. Click and drag the resistor to the right. Place it a few rows down.
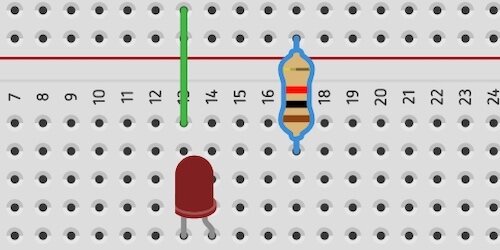
Add a jumper wire from the row with the Anode to the positive rail.

Start the simulation and observe what happens to the LED. The explosion symbol over the LED means that we sent too much current to the LED. A real LED will not work anymore if this happens. Stop the simulation. We’ll add a button so we can use it to turn the LED ON or OFF. That will appear in the next article. In the meantime see if you can attach a button to this circuit on your own.