
Technology lessons for educational technology integration in the classroom. Content for teachers and students.
Create Class OneNote Notebooks with Microsoft Classroom
Microsoft Classroom Notebook makes a great companion for Microsoft Teams. In this book, you will learn how to create, distribute and manage student OneNote notebooks. With OneNote Notebooks you can distribute and collect assignments from students. The collection process is seamless.

Introduction
A Class Notebook can be accessed with the OneNote application once it has been created with the Cloud service. OneNote is available for a variety of devices. These devices include Windows desktops, laptops, Surface tablet, iPad, iPhone, Chromebook, and various Android devices.
A Class Notebook includes three sub-notebooks. These notebooks include Student Notebooks, Content Library, and Collaboration Space. The Student Notebook is a notebook that is accessible to individual students and to the teacher. Student notebooks aren't viewable by other students. The Content Library notebook is a notebook where teachers can share material with students. The content in this notebook cannot be edited by students. The last notebook, Collaboration Space, is used for teachers and students to work on collaborative assignments and projects. This section can be edited by teachers and students. All these notebooks are created at the end of the setup process we will be going through in this first lesson.
Creating A Class Notebook
To create a Class Notebook, log into your Office 365 account and click on the application launcher. The application launcher is usually available from within any of the Office 365 online applications like Outlook. The launcher is located in the upper left corner of the page.

Office 365 application tiles
Click on the Class Notebook tile.

Office 365 Class Notebook application
The Class Notebook page will open. The page has four tiles to help create and manage Class Notebooks. Click on the “Create a class notebook” tile.
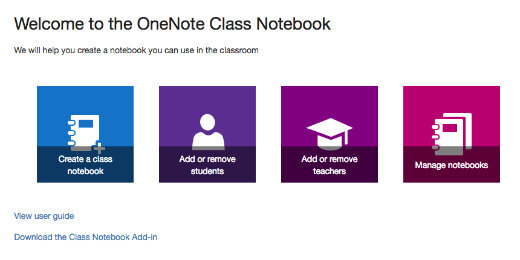
OneNote Class Notebook portal
A series of steps will be listed on the left side. Office 365 will guide us through the process of creating a Class Notebook.

Class Notebook creation process
Provide a name for the class or content that is to be taught. The name of the notebook can be anything relevant to instruction. Special class notebooks can be created for special projects like science fairs or projects. Click the next button.

A message page will inform us that several notebooks will be created. Click the next button.

Overview of content to be created in each notebook
We have the option to include other teachers in this notebook. This is an opportunity to provide the names of other teachers or aides that will be either co-teaching, supporting, or providing instructional content for curriculum and lessons. These teachers will have the same access to the notebook as the teacher that creates the notebook. This means they can view student notebooks and access common classroom sections like the Content Library and Collaboration Space. Teachers do not have access to other teacher notebooks, which are also created during this process. Provide the email address of other teachers if this Class Notebook is going to be shared with another teacher in the organization.
Teachers don't need to be entered at this time. Teachers can be added later in the Manage Notebooks section. We will cover this step later.

Add teachers to notebook management
The next step in the process is to provide the email address of students that will need access to this notebook. Each address can be entered individually or pasted from another application. If the addresses are going to be pasted, each address must be separated by a semi-colon.
Student emails don't have to be entered at this time. It might be better to create the notebook and set up everything before students are invited to the Class Notebook. Students can be added later using the Manage Notebooks section.
If student email addresses aren't available yet, or if you don't want to add students now, click the next button.

Add students to Class Notebook
Class Notebook creates four default sections in each student notebook. These include handouts, class notes, homework, and quizzes. We can add more sections at this time by clicking the “Add more” button. Sections are places where students can create their content for teachers to review and grade. It also provides a way for teachers to help students organize their work and for teachers to quickly access student assignments. Additional sections can be added later in the Manage Notebooks section. We’ll use these default sections and click the next button.

Default sections for each notebook
Click the “Create” button to finish the process.

Overview of content created for notebooks
The Class Notebook is ready and can be opened with OneNote. The OneNote application can be installed on a computer or device. Notebooks can also be opened with OneNote online, which is the Cloud service option for OneNote. Click the option to open OneNote online.

Open OneNote online
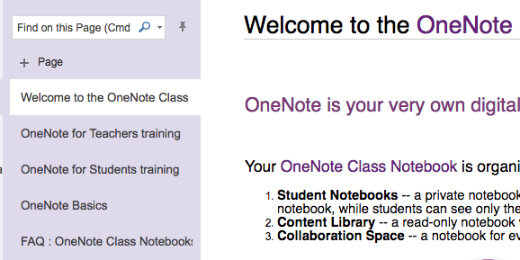
OneNote online will open in a browser and display a welcome page. The notebooks section contains a list of notebooks created under the Class Notebook. In this example, that would be the Physical Science notebook. The Notebooks section includes Collaboration Space and Content Library. Each has information and instructions for using the notebook. Click on the Notebooks link.

OneNote online with teacher notebook
The Notebooks page will open, which contains Class Notebooks and personal notebooks.

Class Notebooks management section
Clicking the Class Notebooks menu option will list the Class Notebooks only. Click the Class Notebook link.

Class notebooks list
Each notebook has pages for taking notes. There are several pages created for us with each Class Notebook. These pages contain information for using the notebook. To create a new page, click the “+ Page” link.
Default pages in teacher notebook
Once the page is created, a cursor will be placed at the top of the page to provide a title. This title will appear in the pages panel for easy navigation to each page.

New page
Press the Return key on the keyboard or click below the title to begin adding content.

Page title and content area
Student Notebooks In-Class Notebook
Student notebooks appear in the Notebooks panel. These notebooks are automatically created and added when student accounts are added to the Class Notebook. They are listed in alphabetical order below Collaboration Space and Content Library.

Teacher view of student notebooks
Click on the disclosure triangle to view the contents of each student’s notebook. Each notebook contains the default sections that were created during the setup. Each section has its own set of pages. Sections are notebooks within a notebook.

Sections in student notebooks
Any work that is done in either the online, desktop or mobile device version of OneNote is automatically saved and synced to the Office 365 Cloud.
Customize Sway with Themes
Presentations in Sway are theme-driven. The choice of colors and fonts is limited. This is done in part to reduce the amount of work that needs to be done to produce a polished presentation.

Themes and design
Presentations in Sway are theme-driven. The choice of colors and fonts is limited. This is done in part to reduce the amount of work that needs to be done to produce a polished presentation. A theme is selected for us during the creation of a sway.
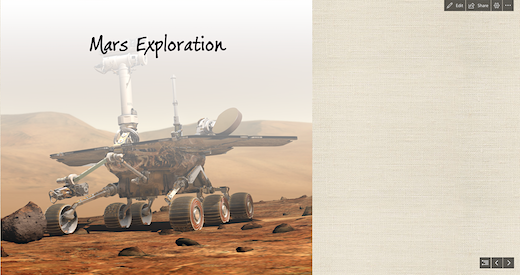
In the previous lesson, we created a presentation on the exploration of Mars. The theme for the project is based on the images. The theme for this project is nice but I would like something different. Go to the button bar and click Edit.
Click the Design tab.

Click the Styles button.

The first option in the Styles panel is the display format. This Sway is set to display the information horizontally. Users will swipe left and right to view the presentation. The vertical option displays content like a traditional web page. The Slides option presents content much like a traditional slide show. We’ll keep the horizontal option for now.
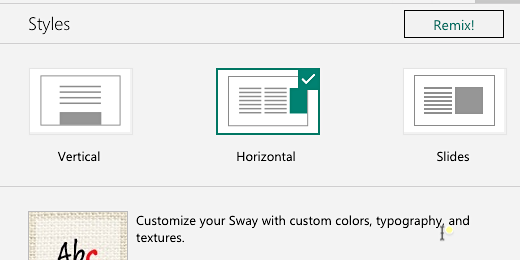
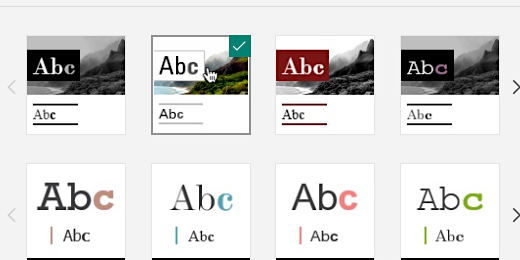
There are several thumbnail samples of themes. Each sample includes a variety of colors, styles, and fonts. Click the first theme thumbnail.

The Sway project updates to match the theme we selected. This theme changes everything to black and white. I'd like to keep the color of the images.

I’ll select the next theme thumbnail. This restores the image colors.
There are other ways to customize the presentation design. Click the Customize button.

Sway uses images in the project for a color palette. The curated palette can’t be changed. Click on one of the other image thumbnails. I’ll click on the mars rover thumbnail.

The color palette options update with suggestions. I’ll click the dark color option in the extreme right.

The image gets a little darker and the background for the text gets darker too.

That’s too dark. I’ll select a lighter option.

There are a few font options. Click the font choices selector.

Select a font option. See how it looks in the project. Select another until you find one that works.

This is looking much better. Click the Play button to preview the project.

It’s looking much better. I would like to keep the images separate. To keep them separate we need to change the presentation mode.

Click the Edit button.

Click the Back button.

Click the Slides option and preview the project.

The rover image is all by itself on the first card.

Use the navigation controls to move between cards.

The images look very nice. The text on the cards is a little too plain.

Click the Edit button. The button bar might disappear when previewing. Move the mouse pointer to the top right so it reappears. Click back on the Storyline section.

Click the triangle to reveal the contents for Galileo.

Click inside the first text card. Select all the text in the card. Click the Emphasis option.

Repeat the process for text on the next card.

Click the play preview button. Navigate to the text card. The text looks nice but it is still lacking something. Go back to edit mode.

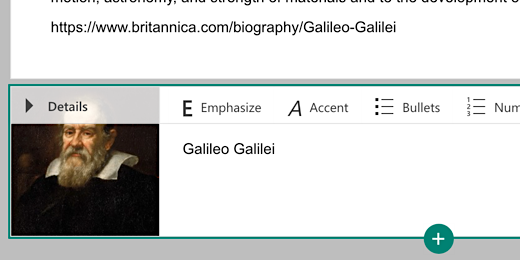
The text cards are on their own. We can group text cards with images to add interest. Add an image card below the second text box. Add an image of Galileo to the card. Make sure to include a caption.
Click the Play preview button and navigate to the information cards. The text from the cards appears to the left of the image. The image is on the right because it is the last card in the group. To place the image on the left side we need to move the image to the top of the current group.

This looks much nicer. Look at the rest of the project. The last two cards include the video and Mars facts. The Mars facts are on their own. They didn’t group with the video card. There is an option to force group cards. Go back into edit mode. Find the Mars video card. There is a box in the lower right corner of the card. Place a check in the box.

Go to the card with the Mars facts and place a check in that box too.

A group option becomes available on the text card above the text area. Click the Group button.

The grouping places the cards to the left and right of each other. The Grid option arranges the cards from the top down then to the right. Leave the Automatic option selected. Click the Play preview button.

The video and text are placed next to each other.

Formatting text
Our text needs some formatting. Go back into edit mode. Go to the Mars facts card.

Click once in front of the first sentence and press the Return key once. This will move the text down. We will add a title to the top of the facts information. Type Mars Facts.

Highlight the Mars Facts text and click Emphasis.

Highlight the Mars Planet Profile text and emphasize it too.

Click the Play preview button. Click the Outline view button. The button is next to the navigation arrows.

Click the Mars thumbnail.

Click the right navigation arrow to get to the video.

These are some of the fundamentals. I use this for my introductory project with students. Students continue to add information from their research.
Student presentations with Microsoft Sway
In this lesson, we learn to use Microsoft Sway basics. We create a basic Sway product with images, videos, and text. Microsoft Sway accesses a variety of resources on the Internet to help develop our project. Follow the step by step instructions to create your own Sway products.

Microsoft Sway
Sway is a free online product from Microsoft. All you need is an Outlook email account. Sway is a storytelling app that presents itself as an alternative to PowerPoint. It presents concepts quickly, easily, and clearly.
Sway is cloud-based. This makes it easy to collaborate on Sway projects. It is also easy to share projects with the world.
Sway is built to tell stories. It uses cards to gather concepts in the form of images, video, and text. Cards are grouped to combine concepts similar to paragraphs in a narrative.
Themes take the guesswork out of designing backgrounds and selecting fonts. This is a definite plus. My students often spend too much time selecting colors and fonts. I would rather they spend time developing content. There are plenty of theme choices.
Import a variety of media to create a nice visual presentation. Images and videos can be imported from online resources. Searches for online content are filtered for media in the Creative Commons. This assures that content does not violate copyright. It is easy to add content from a variety of other sources. These sources include OneDrive, Google Drive, Flickr, and our device.
Pull in existing PowerPoint presentations and Word documents. For best results, documents should be formatted with proper headings.
A browser is all we need. Sway presentations work on any device.
Creating A Sway
Sway is available online and is free to use. All that is needed is an email account. Schools with children under 13 can use district accounts. Microsoft provides Office 365 resources for Eduction.

The easiest way to access Sway is to type https://sway.office.com in a browser's address bar. Click the Get Started button or click the login button at the top of the page.
Templates are available to help get started on a project. These templates are a good way to understand what Sway does. I encourage you to view some of these templates.
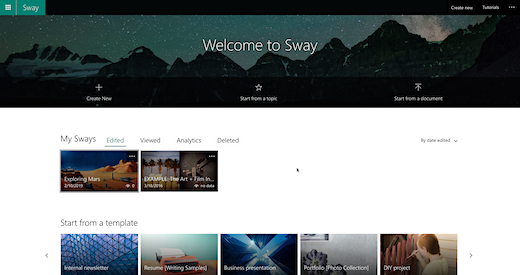
The Sway home page provides some examples. These projects are a good way to learn what is possible with Sway. They are developed by others in the Sway community. The projects in the community have a professional look and feel. Sway makes it easy to create nice products without too much effort.
The banner area of the home page has three options. The first option on the left creates a new empty project. This is where we will begin in a moment. The center option is similar to using a template. We start with a topic. The topic uses keywords to gather resources from Wikipedia and develop an outline for a project.
The third option located on the right begins with a document we created in Word or PowerPoint. Sway uses the content in these documents to develop a Sway outline. This is a helpful way to convert existing PowerPoint slides to Sway projects.
Mars Exploration Sway
We will develop a project where students have researched the exploration of Mars. The exploration will begin with the history of its discovery and documentation by Galileo with his telescope. The research will take us to the most recent explorations with satellites and robots.
We will begin with a new empty project. This way we can see how different media and content are added. Sway uses cards to organize and present content. This is similar to PowerPoint slides. Each card contains a media element. These elements include images, text, video, and audio. Click the Crete New button.

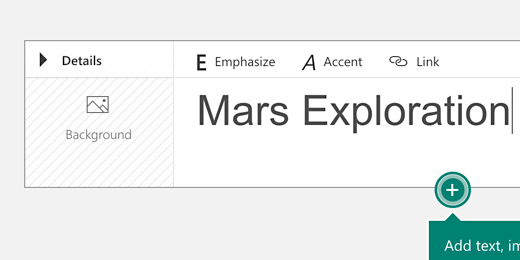
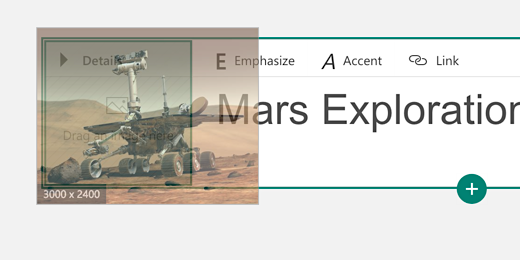
We are presented with the first card in our Sway project. The card is a title card. Enter the title "Mars Exploration".

To the left of our project title is a place for us to include a background image for the card. Click once on the background place holder.
A panel opens on the right side of the project page. This panel provides suggestions for background images based on the title of our project. Click the Mars Exploration suggestion.

The panel displays a variety of images related to Mars and Mars exploration. The top of the panel includes a section for images and videos. We are currently in the images section. All these images and videos are covered by the Creative Commons license.

There are a variety of images on the internet. Many of them are of good quality and others are not. It is usually best to select images that are of the best quality possible. This is especially true for background images. Background images will need to stretch out across a web page on small and large displays.
The resolution of each is shown below the image. The image with the largest resolution is in the top right. It has a resolution of 3000 by 2400 pixels. The image with the lowest resolution is 500 by 500 pixels. Click once on the image with the highest resolution.
During the selection of the image we learn about image resolution and how to gather images with good resolution.

Click the Add button.

We can also drag and drop the image onto the placeholder.
We have just created our first card. To create additional cards we click the plus button on the bottom of the current card.

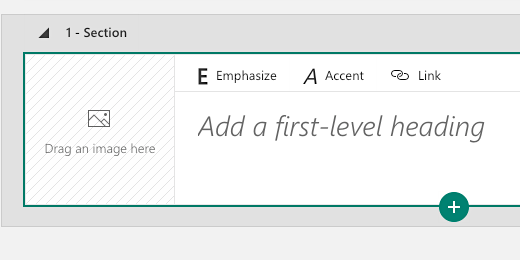
A box with several menu options appears. Sway cards work best when they have a top-down order. The first card in our project is a title card. Our next card should be a heading. There are two types of headings. Heading 1 is used after titles. It is referred to as a first-level heading. Heading 2 is used after heading 1. Click the Heading 1 option.

The heading 1 card is similar to the title card. The first heading in our presentation will provide information on Galileo. Type Galileo Galilei in the first-level heading box. Galileo was the first to observe and document Mars with a telescope.
Go to the media panel and type Galileo Galilei in the search box.

A variety of images for Galileo appear. I want a high-resolution image. Use the one that has a high resolution and works with the presentation.
Discuss choosing images that relate best to the content. We look at several images and discuss why they might or might not be the best choice for our project.

There is more to Sway than images and headings. Sway provides a nice way to display written information.

Click the plus button below the Galileo card and select the text option.

Add some text in the card related to Galileo.
Information for the text is gathered with the class before we begin to create our project. This reinforces the importance of content as the driving reason for the project.

Let’s add another card. This card will provide basic information on Galileo.

Let’s take a look at what we have done so far. The heading 1 card and each text box are grouped within a larger box. This grouping is helpful when we develop large Sway projects. Grouping is useful when students are working collaboratively. Each student can produce a group of information cards.

The heading card has a triangle to the left of the title. This triangle collapses a grouping.

Collapsing groups helps when working on large projects.

Create one more grouping. Create a new card and select the heading 1 option. Title the card Mars the Red Planet.

Click the background option. Select the Mars recommendation in the suggested searches panel.

Find a nice image for the background.

Add a little more interest to the Sway presentation. Click the videos section.

Look for a short video. I found one from National Geographic. This video is a little over three minutes long.
Discuss why the length of a video is important in a project. Bring in discussions of the audience and their expectation. Have a conversation over how to balance our need to present information and the audience need to be informed and entertained.

Click and drag the video below the current card.
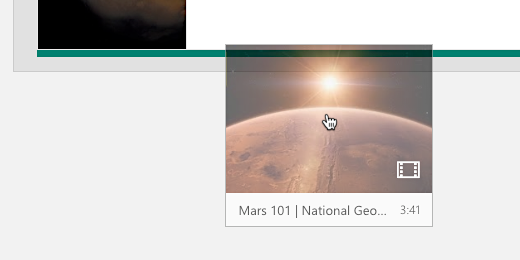
A new card is created with the video. The card includes an option to include a caption. This caption appears above or below the video. The location depends on the theme. The caption for the video will credit the source.
Discuss the importance of citation in any publication.
Type National Geographic in the caption box.

Click the plus button and add a text card. This text card will provide basic information and data on Mars. The bottom of the information text contains a link to the source for citation.

Preview the project by clicking the Play button. The button is in the button bar at the top of the page. Go ahead and create your own Sway presentations. All Sway products are saved and stored in your Microsoft Cloud account.
Splitting Cell Contents in Excel
The online version of Microsoft Excel has some limitations, but with some basic functions, we can perform some routine tasks. In this lesson, we will pull out keywords from cell contents using a function called LEFT.

Splitting cell contents with functions
The online version of Microsoft Excel has some limitations, but with some basic functions, we can perform some routine tasks. In this lesson, we will pull out keywords from cell contents using a function called LEFT.
In a previous lesson, we collected data with Microsoft Forms. The form surveyed students for their interest in summer programs.
We exported this data to an Excel spreadsheet so we could create our charts. Some of the data was easy to chart. The data that contains our preferred activities are combined into one cell. This makes it a little difficult to create a chart.
We need to separate the different activities that are grouped. We need to know the number of first-choice options. To count the number of separate first-choice selections we need to separate it from the rest of the data.
The online version of Excel has a limited set of tools. To do what we need online we need to use built-in functions. These functions are part of the full version of Excel. They are conveniently placed into a menu option for us. The online version doesn’t have this menu function so we need to do things manually.
Okay, why go through all of this? Why not just use the full version of Excel to do what we need? Great question. Not everyone, students, can afford to purchase Excel. The online version is free. If we have to use the online version then we need to know how to take advantage of the available tools.
In this lesson, we will separate the information we need. We will use a count function to count the number of first choice activities. In between, we will learn a few more functions. This information will help us to create our chart.
LEFT Function
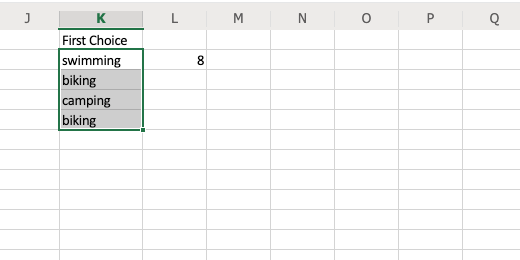
To separate the text in the column we need to learn a couple of functions. The first function finds content in the cell and places it into another cell. Skip a column after column I and go to column K. Type First Choice into the first cell. Press the Return key to go to the cell below.

New column and heading for data
Type the equal sign. The equal sign informs the cell we are going to use a formula or a function. Type the word LEFT. Left is a function. Type the word in uppercase letters. There is nothing special about using uppercase letters. But, It does help identify the function. Excel provides basic information about the function. This function returns a specified number of characters from the start of a text string. A text string is any text.

The Left function
Type an open parenthesis. The parameters of our function are placed with parenthesis. Parameters tell the function what the text is and what we want to do with the text. The parameters required are provided as help text by Excel. We need to include the text and the number of characters.

Function parameters
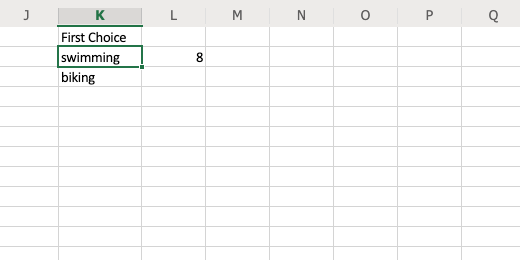
The text we want to extract is in column H. We want to extract the text from the first cell under the heading in column H. The text is in cell H2. This means that the contents are in column H and row 2. Type H2 followed by a comma. Using the cell coordinates H2 is called cell referencing. Cell referencing points to the contents of a cell.

Text parameter
We need to provide the number of characters to pull out of the text. The word ‘swimming’ has eight characters. Type the number 8 followed by the closing parenthesis. Press the Return key.

Character count parameter
The word swimming appears in the cell. This word is being pulled from the contents in cell H2.

Function with first text selection
Go down to the cell below and type the function to return the contents from cell H3. Here is the function, =LEFT(H3,6). The word biking is pulled from the text. This is great but we need to count the number of letters in each word we want to extract every time. We need a way for Excel to do this work for us. That brings up the next function we are going to use.

Second text selection with function
Search function
Each word in our cell is separated from the next with a semicolon. We are going to use this marker to help identify the word we want to extract. We are going to instruct Excel to find the semicolon and pull all the text before it. Let’s see how this works. Click on the cell next to the word swimming, cell L2. Type the equal sign and the word SEARCH. The search function looks for characters in the text.

Search function
Type an open parenthesis to provide the parameters for the function. We need to provide the text or characters to find, and where to search.

Search function parameters
Let’s see how this works. Type a character from the word we need. Type the letter g. Place the letter within quotation marks. *Quotation marks are needed anytime we need to refer to a piece of text. Text like letters and numbers are different in Excel. *Type a comma after the closing quotation mark.

Search for character in text
The text is in cell H2. Tye H2 after the comma and add closing parenthesis. This function will search for the first occurrence of the letter ‘g’ in the cell. It will return to us the position of the letter. Press the Return key.

Search for character in cell contents
The number eight tells us that the letter ‘g’ is the eighth letter in the text. This matches with what we know. This is the information we provided in the previous function. All the words we used for the activities end with the letter ‘g’. We can simply look for the letter and use it in the function. What if all our words didn’t end with the letter ‘g’? The character that is consistent in all the texts is the semicolon.

Position of character in searched text
Updating our function
Let’s combine both functions to deliver the results we need. Click on the word swimming in cell K2. We need to update the function for this cell. The function is hidden by the results of our function. To edit a function it is often better to edit it in the formula bar.

Combining Left and Search functions
The formula bar is located below the ribbon. We see the function in cell K2.

Using the Formula Bar
Erase the number 8 from the function and type the word SEARCH.

Using Search in place of the character count
Type opening parenthesis. Type the semicolon character within quotation marks. Type a comma after the closing quotation mark. Type the cell where we want to search for the semicolon, cell H2. Type a closing parenthesis after the cell reference.

Searching for the semi-colon character
Looking at the contents of cell K2 we see that the word “swimming;” appears in the cell. The contents include the semicolon. That doesn’t look right. We need to get rid of the semicolon.

Word result from functions includes semicolon
Return to the formula bar. The search function returns the location number. The location number for the semicolon is 9. We know this because the location for the letter ‘g’ is eight. We need to subtract the location of the semicolon. Tye a “-1” between the closing parenthesis. Don’t include the quotation marks. We are taking away one from the total count.

Subtract one character to remove semicolon
The word in cell K2 appears without the semicolon.
Copy cell contents
We need to copy this formula down to the other cells in the column.
Using the copy handle
Look at the highlight border of the cell we have selected. In the bottom right corner is a small square. Move your mouse arrow to the square. Stop when it changes to a plus sign.

Click and drag the copy handle
Click and drag the square down to cell K5.

Copy to several cells in the column
The formula is copied over the formula in cell K3. It is also copied to cells K4 and K5. Click the square and copy the formula to the rest of the cells in the column. Stop when you reach the last row of responses.
The formula successfully copied to other cells
Counting responses
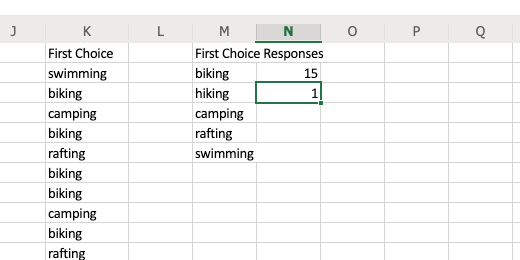
We need to count and group the responses for each choice. Go to cell M1 and type the heading First Choice Responses. Type each response option in a separate cell below the heading. *Click on cell L2 and press the delete key to erase the test function we used.*

Table with choices to count each selection
Click cell N2. This is the cell to the right of biking. Type an equal sign and type the function COUNTIF. This function counts the number of cells in a range that meet a criterion we provide. We are going to have the function look at the content in our first choice column and count the number of times the work biking appears in a cell.
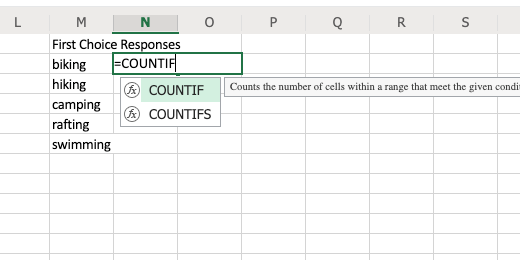
The COUNTIF function
Type an open parenthesis. Type K2:K32 after the parenthesis. We specify a cell Range by typing the first cell in a Range followed by the last cell. The rows in column K from K2 to K32 are highlighted. Type a comma after the Range values.
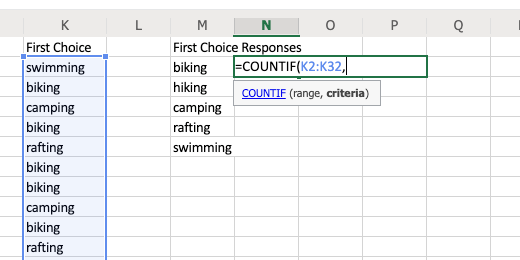
The COUNTIF function range parameter
We need to provide what to search for in the selected range. We want to search for the word biking. Type the word biking within quotation marks. Type a closing parenthesis after the closing quotation mark. Press the Return key.
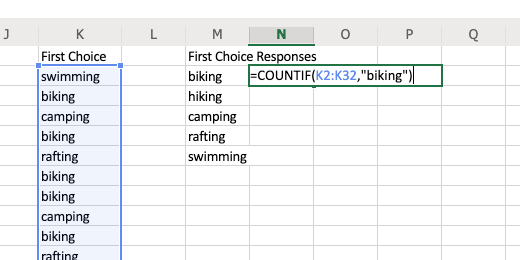
Counting the number of times the word biking appears in the range
Biking is selected 15 times as the first choice of 31 responses.

Function returns the number fifteen
Repeat the process for hiking. Go to cell O3 and use the COUNTIF function. Look for hiking. The formula looks like this, =COUNTIF(K2:k32,”hiking”).
Create the function to count the choices for hiking
Repeat the process for the other choices. Biking is popular for a first choice. It is followed by rafting and camping.

Function used to count all choices
We have the information needed to create our graph. I recommend creating a circle chart.
Microsoft Form Responses with Excel
Information collected with Microsoft Forms is collected in a response page. The response page arranges the collected information into graphs. The graphs themselves are interactive. Exporting the data to Excel provides a way for us to generate our own graphs.

Form Responses
Information collected with Microsoft Forms is collected in a response page. The response page arranges the collected information into graphs. The graphs themselves are interactive. Exporting the data to Excel provides a way for us to generate our own graphs.
Microsoft Forms is a nice tool for collecting survey information. Once we collect the responses, they appear on the response page. The Response page is available when editing the form. The responses are nicely organized for us with graphs that represent the answers for each question.
I created a form to survey students on summer activities. This is from a previous lesson, Microsoft Forms An introduction. The form has received 31 responses.

summer survey of activities
Click the Responses tab. Responses to each question are graphed. The responses for the student’s age are placed into a circle chart.

Form created charts
The responses for the activity choices are placed into a horizontal bar chart.

Form horizontal bar charts
The chart is a stacked bar chart. Rolling our mouse arrow over one of the charts displays information about the data. The example in the image below shows that 48.4 percent of the respondents selected biking as their first choice.
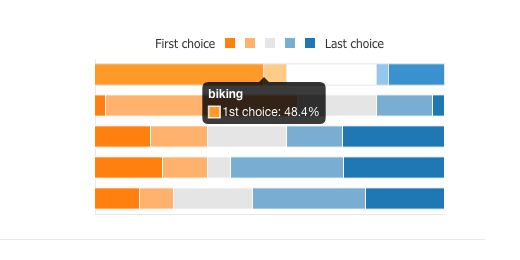
Interactive bar chart
The next section in the graph shows that 6.5 percent of the respondents selected biking as their second choice.
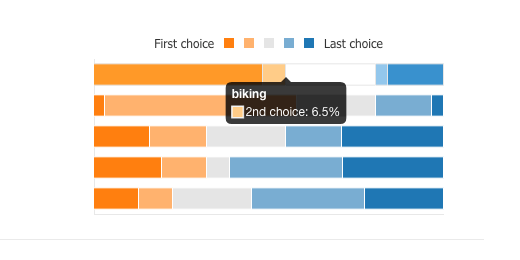
Interactive bar chart example
There is an Excel link at the top of the Responses section. This gathers all the form results and exports it to an Excel spreadsheet. The data in the spreadsheet is downloaded to your computer.

Open in Excel link
I want to upload this file to my online OneDrive account and create charts using the online version of Excel. In this way, we can access the file anywhere and on any device.
Excel online
Click the apps launcher and select the Excel tile.

Excel Tile from Apps Launcher
The option to upload a workbook is found on the top right side of the Excel portal. I’ll click the Upload a Workbook link. The workbook is titled Summer Activities Survey.

Upload a workbook
The spreadsheet has several columns of information. The columns that interest us are the last three. These columns include the child’s age, favorite activities, and if they need transportation. This is the data we can use to create charts.
The data that is easiest to chart is the student ages and if students need transportation. The choices for activity are not easy to chart. This data needs to be separated before it can be graphed.

Form spreadsheet responses
Microsoft Forms: An Introduction
Create polls and surveys with Microsoft’s free form application. All you need is a free Microsoft account. Create and share forms online. Nothing to install.

A Basic Form
Microsoft Forms is an application for creating polls or surveys. The form is created and shared online. You don’t need to purchase Microsoft Office 365 to use Forms.
Microsoft offers basic services for free with their Outlook email account. The services are all Cloud based with support for apps on mobile devices. The services include the three major applications. For the purposes of these lessons I will be using a free account. I want you to be able to follow along even if you don’t have a Microsoft Office 365 purchase.
I recommend using the Microsoft Edge browser on Windows devices. Use the Chrome browser on Mac computers. Apps are available for mobile devices but I will not be using them in these lessons.
Log into your Microsoft account. Logging in usually takes you to the Outlook email application. We will begin there. The apps and services are available from the apps launcher. The launcher is an icon made of nine tiny squares. The launcher is located in the upper left corner. The launcher is found here in all applications.

Office 365 apps launcher
Click the launcher and select OneDrive. I like to start form OneDrive whenever possible.

Office 365 OneDrive
Click the apps launcher in OneDrive. Look for the Forms tile and click on it.

Office 365 Forms
The Forms landing page has two buttons and one sample form. There is a button to create a generic form and one to create a quiz form. Click the button to create a generic form.

Office 365 basic form
There isn’t much on the form now. Click on the Untitled form name and change it to Summer Activities Survey. There is an option to provide a description. This is a good place to provide information about the goal of the survey. Provide a brief description. We want students to let us know which activities are their favorite.

Form name and description
Every survey begins with a question. Click the Add new button to create the first question. We need to collect the student’s name. Select the text response option.

Form text response option
Fill in the question to prompt them to enter their name. We need to make sure the student’s fill in this information. We need to make the answer required. Enable the required option for the question.

Form answer required
We need a question to get the student’s age. This will help schedule the children with others in the same age category. Create a new question. Select the option to request an answer from a set of choices.

Form question answer choices
Prompt the student for their age. Provide the possible answer choices. The choices range from 10 to 13. Enable the option to make the question required.

Student age answer choices
We want the student to list their favorite activities from most to least favorite. Create a new question. Click the three dots on the extreme right. This is the actions menu. Select the Ranking option. This generates a question with some interactivity for students.

Form Ranking question type
We want students to list the activities by moving them up or down the list. They will move their favorite activity to the top of the list. Their least favorite will be moved to the bottom. We are giving them a choice of five activities. The activities are hiking, swimming, camping, biking, and rafting. Make sure the question is required.

Ranking question answer choices
Add one more question. Create a question with a select response. We want to know how many students need transportation services. The form anticipates that we are prompting for a yes or no response. It is offering suggestions to fill in the form for us. Click the Add all button. This includes the maybe option.

Forms smart assistant answer choice options
Previewing the form
That is all the information we need to gather with the form. Let’s see how the form works. Click the Preview button. It is in the button bar at the top right.

Form Preview button
Go to the question with the activity choices. Click and drag the activity choices up or down to see how they work.

Click and drag to sort activity choices
Fill in the information. Click the Submit button. A thank you message appears when the form is submitted. Click the back arrow to return to edit mode.

Thanks message after submitting the form
Form responses
Microsoft Forms collects all the responses and creates a variety of graphics. This helps us visualize the data. Click the Responses tab.

Form Responses tab
This gives students an idea of what the graphs will look like. They will be more informative once students begin to fill out the form. The charts update as forms are submitted.

Form Response charts
We took the survey and our response is part of the data. We should clear our response from the form. Click the actions menu and select Delete all responses.

Deleting our response from the form
Sharing the form
Once the form is set we need to make it available. Click the Send button.
Form Send button for sharing
A link to the form is created. Click the copy button. This copies the link into the computer’s memory. Once in memory we can paste the link anywhere. There are other options for sharing the form. Click the button to the right of the link button. This is the QR code generator.

Form share link
An image is generated. This image represents the link to the form. Devices like smartphones with cameras use this image to capture the link. The image represents symbols the device and software detects. This image is interpreted as the link to the form. This image is useful when your audience is going to use mobile devices to access the form. It avoids having to type out the link in the browser. Click the button to the right of the QR code button.

Form link QR Code
This button generates embed code. Embed code is used to place the form inside a web page. The link to the form is surrounded by code that instructs the web page to place the form in the page. The last icon sends the link out in an email.

Form embed code for web pages
The link is placed on my classroom site. I like to use all the link options. The embed code is useful for keeping the user on my classroom website. The link for the form works best with users using mobile devices like smart phones. I do this because the screens are too small on phones to accommodate the form and web page. I include the QR code on the page so users of mobile devices can easily access the form by scanning the code.
Take a look at the form here. The form is disabled so you will not be able to submit any responses.