Weather Station Project: Lesson 4

Temperature and humidity sensor
Introduction
In this lesson, we connect the DHT 11 temperature and humidity sensor to the Raspberry Pi. The sensor is attached to a breadboard. Leads are used to connect the sensor pins to the GPIO pins on the Raspberry Pi. On the Pi, we download the DHT sensor library from Adafruit. The library has an example code to test the sensor. We will edit the example to read the sensor information.
Connecting the sensor
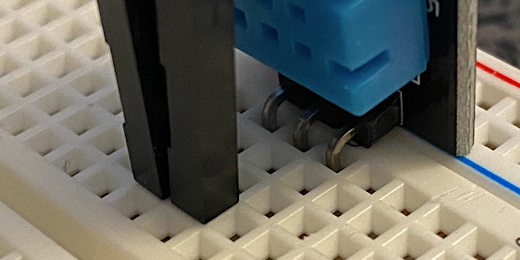
The temperature and humidity sensor is in the Elegoo Adruino kit. The sensor is model DHT11. This model number is important We will refer to it a few times in this lesson. The sensor is shown in the image below. The sensors themselves are enclosed within the blue plastic cover. The bottom of the sensor has three connectors. One connector receives power from the Raspberry Pi board(vcc). Another connector sends information to the Pi(data). The third connector is the ground connector.

The kit comes with a CD that contains information and resources for the modules and sensors. Most computers don't come equipped with a CDROM. To get the information for the DHT11 sensor we need to use the Internet. The information for the sensor is found using the link below. I have replicated some of the important information we need for the project.
http://www.circuitbasics.com/how-to-set-up-the-dht11-humidity-sensor-on-an-arduino/
The first pin on the left connects to the Raspberry Pi's GPIO pin. It outputs both temperature and humidity information. The second pin is referred to as the Voltage at the Common Collector, Vcc pin. The sensor module accepts voltages ranging from 3.3 volts to 5.5 volts. The third pin is the ground pin.
The breadboard
We need a breadboard to connect the sensor to the Raspberry Pi. The Elegoo kit contains a solderless breadboard. It looks like the image below. A breadboard contains a series of holes. The holes are organized into columns and rows. On either side of the breadboard are red and blue lines. The red lines have a plus symbol at either end. The red lines have a negative symbol at either end. All the holes along the red line are linked to each other. The same is true for the holes along the blue line. These are used to provide electric current for circuits. They are referred to as the negative and positive rails. This is because they are like the rails of a train track.
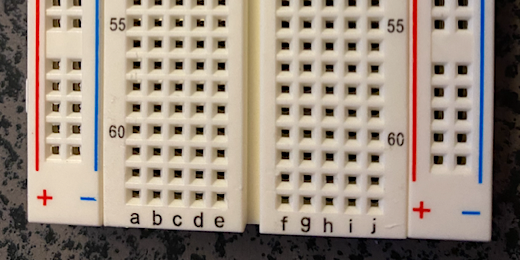
There is a groove down the center of the breadboard. It is often referred to as the trench. This divides the connections on the breadboard. This is also the reason why there are two sets of red and blue lines.
The columns for the holes between the rails are labeled with letters. The holes in these columns are not connected down the column like the negative and positive rails. The holes are connected in rows. For example, the holes from row a to e are connected. One row does not connect to another row.
The wires from the sensor plug into the holes on the breadboard. Handle the sensor carefully. You should use the static strap when handling any sensor. Get the sensor module and plug it into the breadboard. Each sensor connector goes into a separate hole. Each hole needs to be part of a different row. I recommend placing the sensor module in the center of the board along column 'a'. The sensor module in my image is between rows 25 and 35. Plugin the sensor so the blue sensor housing is facing the center of the breadboard.

Lead wires
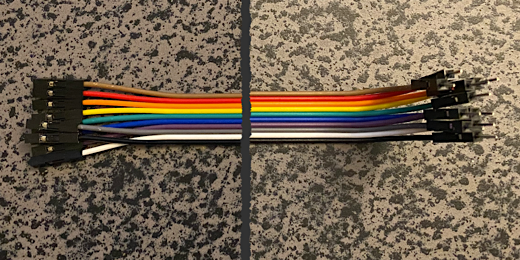
In the kit, you will find several wires. These are called Lead wires. They are used to make connections between electronic components or modules. There is a bundle of long lead wires. One end of each wire has a pin. The other end has a receptor for a pin. The wires are joined together but they are easy to separate. You need three lead wires. Get a red, green, and black wire. Red wires are used to identify connections to electric current. Green wires are used to identify connections to ground. Black wires are used for data but we can use any color for the data.
Get the pin end of the black lead wire. Plug it into one of the holes in the row for the data pin on the sensor module. Remember, all the holes in a row are connected.

Get the pin end of the red lead wire. Plug it into the row for the Vcc pin on the sensor.
Get the pin end of the green lead wire. Plug it into the row for the ground pin on the sensor module.

Raspberry GPIO pins
We are going to connect the sensor to the Raspberry Pi. Make sure the Pi is shut down and the power source is disconnected.
Pins are sticking out of the Raspberry Pi. These are referred to as GPIO, General Purpose Input/Output pins. There are 40 pins.
The pins are not labeled on the board. To know which pins to use we need to look at the pinout key for the board. I have created a pinout table for the board. The image of the table and bard is shown below. The table represents the various voltage, ground, and GPIO pins. I have drawn lines for the pins we are using to connect the sensor module.
The first pin at the top of the board is pin 1. This pin provides 3.3 volts. The pin next to it provides 5 volts. Our module is capable of using 5 volts. Most lessons with this module use 3.3 volts. The ground pin is on number 6.
The voltage and ground pins are different from GPIO pins. GPIO pins do not provide voltage. They send and receive information.
There are several GPIO pins to use. I chose to use GPIO23.
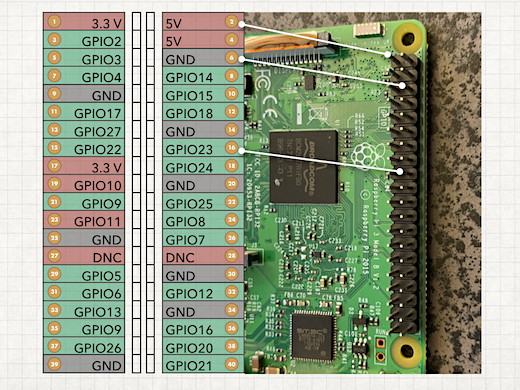
Connect the other end of the lead wires from the sensor to the corresponding pins on the Raspberry Pi. Red goes to pin 1, green to pin 6, and black to GPIO23.
Make sure the Raspberry Pi is not powered on. Never connect or disconnect any circuit to the Raspberry Pi while it is powered. Doing so could damage or destroy the Raspberry Pi. It could also damage modules and sensors.

Get the micro USB power cable for the Raspberry Pi and plug it in. You can connect the Raspberry Pi to an external display if you want. There is no need because you won't see anything. Everything is done and viewed through the SSH terminal window. Wait until the green light on the Pi stops blinking before attempting to log in with SSH.
DHT sensor packages
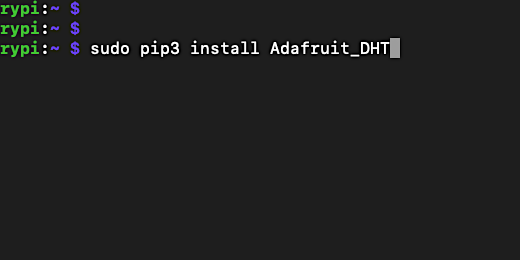
We need to install the DHT sensor packages. These packages are used by Python and our code to retrieve data from the sensor module. Type sudo pip3 install Adafruit_DHT. The packages are created and maintained by Adafruit. Adafruit creates and sells a variety of sensors and modules for Raspberry Pi and Arduino.
Sensor libraries
There are some libraries available to help us get started. Libraries are resources to help make the process of connecting top sensors and other components easier. The libraries include some examples for using the DHT sensor. One of these examples includes the code for accessing the Google Sheet for our data. Using this example will save us some time.
To get the files we need to set up a free GitHub account. GitHub is an online repository for storing, sharing, and distributing code. It is used by millions of develops to store their projects and share them with the world.
You don't need to be a programmer to get a GitHub account. Although, with all the work you have done so far I think you qualify. Go over to github.com and create an account. All you need is an email address. Remember the username and password for the account. We are going to need it in the next few steps. Keep the browser open and remain logged into the account.
We need to install the Git service onto the Raspberry Pi. Type sudo apt-get install git -y. This is similar to previous installations. The final command in the line includes '-y'. This is a command-line flag. When installing packages we are often prompted to confirm the installation. The process stops and waits for our response. The '-y' instructs the installation service to agree to the installation for us. This saves some time.

After the installation is complete we need to configure our account to retrieve content from Github. Type git config --global user.name "Your Name". Replace "your name" with the username created in the Github account. Leave the quotation marks don't erase them. You won't get a response unless the username is wrong.

Type git config --global user.email email@example.com. Replace email@example.com with the email used to create your Github account. You don't need the quotation marks for the email information. That is all there is to it.

We are ready to download the Adafruit DHT libraries. We need the address to the libraries in Github. The libraries are available from this URL, https://github.com/adafruit/Adafruit_Python_DHT. Copy this link. Paste it into the command line after typing git clone. Type git clone https://github.com/adafruit/Adafruit_Python_DHT.

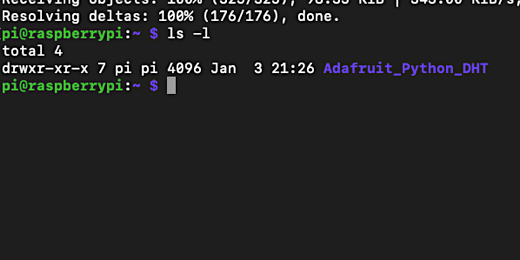
The library is downloaded and saved to the Pi account home directory. We haven't looked at the home directory yet. Type ls -l to get a listing of the items in the home directory.

There is one directory. This is the DHT-sensor-library. A directory is like a folder. We know this is a directory because of the letters displayed on the right. The directory information contains letters that identify the permissions available for the directory. The letter d identifies this as a directory. The letter r means we have permission to read or see the contents. The letter w means we have permission to write or change the contents. There are several levels of permissions. That is all we need to know for now.
Reading sensor data
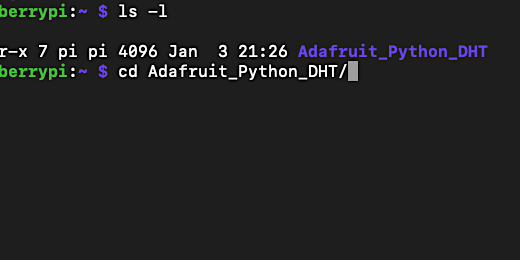
The repository library we downloaded from Github contains some sample files. One of these sample files reads information from the sensor. We are going to open the directory to see the sample file. Type cd Adafruit_Python_DHT/. The cd command is used to change the directory. Think of it as opening a folder on your computer. We are moving from our home directory into the DHT library directory.
Type 'ls -l' to see a listing of the files in the folder.

There is another directory named examples. Type 'cd examples/'.

Type 'ls -l' to get a list of the items in the directory.

We are going to use the simpletest.py file to get information from the sensor. Before using the file we need to make some modifications to code in the file. We will use a text editor that runs from the command line. The text editor does not have a graphical user interface like modern editors. Use arrow keys and keyboard commands to move around.
To open the file for editing we type the name of the text editor followed by the name of the file to edit. The name of the text editor is called nano. This is not the only text editor but it is one of the easier ones to use for those new to command-line editors. Type 'nano simpletest.py'. The '.py' is the file extension and identifies this as a Python file.

The command-line screen is replaced by the nano text editor. There is a lot of commented text at the beginning. This commented text is information regarding the file. The cursor appears at the top of the text file on the first line.
The '#' is used to comment text. This text is different from instructions sent to the Pi or sensor. It is usually information that documents what the code does. Most programmers thoroughly document their code.

cursor location at the beginning of the file
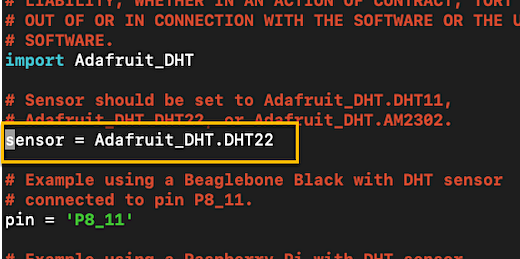
Use the down arrow key on your keyboard to move the cursor to the line that begins with the word sensor. This line identifies the sensor we are using. The sensor is currently set to the DHT22. This is a newer version of our sensor the DHT11. I will go over the differences in a future lesson.
Use the right arrow key to move the cursor to the end of the line.

Press the backspace key on Windows or the Delete key on Mac to erase the number 22. Type the number 11 after DHT.

Use the down arrow key to move the cursor to the line that begins with the word pin. The cursor moves down the lines relative to its last position. This is why the cursor rests at the end of the line.

The code in this example is set up to work with a different device. The PIN is set for that device. The device is called a Beaglebone. Our device is the Raspberry Pi. To work with our Raspberry Pi we need to change the PIN. The sensor is connected to GPIO23. Erase the pin information and type the number 23.
The commented information provides information for providing the number when using a Raspberry Pi. This an example of documentation by the programmer of this example.

Move the cursor to the bottom of the text file. The last few lines are what retrieves the data from the sensor. The instructions get information from the sensor.
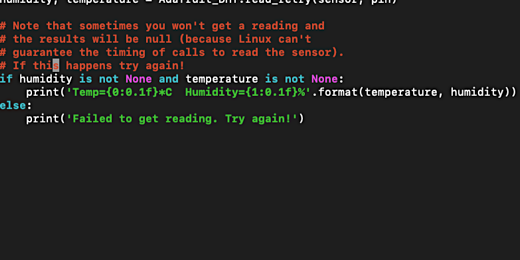
The first line, if humidity is not None and temperature is not None:, checks to see if the sensor is sending data. The 'not None' is asking if there is something.
The second line has several components. It prints the temperature and formats it using from the instructions.
The code “print ( 'Temp = *c” instructs Python to show the temperature with one decimal value. The number one after the decimal point sets the number of decimal places. The letter 'f' is used to format the number as a floating-point value. This means the value includes decimals. The letter 'c' returns the temperature in Celsius.
Floating-point values are used when the number contains decimals. Numbers that do not use decimal values use Integer values.
The code “Humidity = %” displays the humidity value with one decimal place value. The percent symbol is used to represent the value as a percentage.
The “.format(temperature, humidity)” describes the order in which the information is to be displayed.
The last line runs if there is no information from the sensor. A message appears and the code returns to the beginning and listens for information from the sensor. If everything goes well we will not see this line.
We need to save the changes. The bottom of the editor provides information on how to do that. The little arrow symbol next to the letters represents the Control key on your keyboard. To save the information we press the Control key and the letter 'o' at the same time.

The name of our text file appears. We are asked to confirm that we want to save changes to the file. Press the Return key to confirm. This is similar to File and Save as in a word processor.

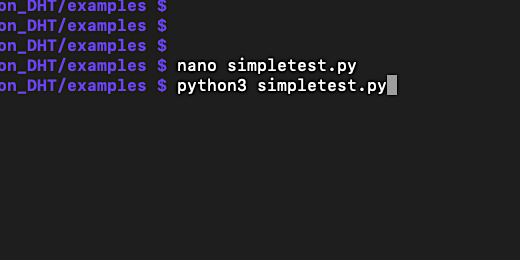
Press the Control key and the letter 'x' to exit the editor.

We are returned to the command line. To run the program we need to type the application and the file to be opened. Type 'python3 simpletest.py'.
The program responds with the sensor data. In my example, the temperature is 24 degrees Celsius. The humidity is 22 percent.

The script will continue to return the sensor temperature and humidity information every 30 seconds. The script contains a loop that continues until we stop the script. Press Control+C to stop the script. The command prompt will display after the last reading.
Run the script again at anytime by typing the same command.
Don’t forget to shutdown the Raspberry Pi before disconnecting the power. Log back in if you forget to shutdown before quitting the SSH terminal session.
If the sensor does not work then here are some things to try. Make sure the connections are correct. The lead wires on the sensor should be firmly in place. The lead wire colors from left to right are black, red, and green. The red wire is on pin 1 on the Raspberry Pi to receive 3.3 volts. The green wire is on pin 6. The black wire is on GPIO23. This is physical pin 16.
If it still doesn't work then check the simpletest.py file. Use the nano editor to open the file. Make sure there are no stray characters. Make sure everything is typed correctly. Save the file and try again.