Technology lessons for educational technology integration in the classroom. Content for teachers and students.
The mBot robot and basic motion
The mBot robot is useful when teaching math, science, and coding concepts. Once the robot is assembled we begin with the fundamentals. These fundamentals include coding the robot’s microcontroller to activate the motors so mBot moves.
Basic math, science, and coding concepts
I like using the mBot in the classroom. It is useful when teaching math, science, and coding concepts. Once the robot is assembled we begin with the fundamentals. These fundamentals include coding the robot’s microcontroller to activate the motors so mBot begins to move around. Once the robot is moving we begin to learn about motion, velocity, and acceleration. This leads to lessons on Newton’s Laws of Motion.
Make sure the robot is not on a table where it can easily roll off and come crashing to the floor. I recommend placing the robot on the floor for the first few examples. You can also place the robot on a small paperback book so the wheels are free to spin.
The application to program the mBot is available online or as a download for your computer or device. Go to https://mblock.cc. Programming in the browser version of mBlock 5 requires an account. There is account integration with Google so students can easily create their accounts. This is useful if your school district uses Google account services.
Create a new project by clicking the new project button on the startup page. Provide a title for the project. Click the word Untitled next to the image of a diskette.
Name the project “Move forward and back”. Don’t include the quotation marks.
We need to load the robot into the development environment. Loading the robot loads the code library for the robot. This code library provides some specific code blocks for mBot.
Go to the Devices section under the Stage and click the Add button. The button is next to the Cody Device.
A Device selector window will open. Click the mBot device and click the OK button.
There are two devices in the Devices section. The mBot device is selected. A blue highlight appears around the selected device.
The codes panel updates with the categories and code blocks for the mBot. The first code block in the Action category is used to instruct the robot to move forward.
Using code blocks to build scripts is easy and intuitive. Click and drag the first code block onto the canvas area on the right. This code block has two number values. These values are inside small ovals.
The move forward code block is used to send instructions to the micro-controller on the mBot. The micro-controller sends instructions to all the components on the board. It also sends instructions to the components attached to the board.
The micro-controller interprets the instructions in the code block. The instructions in the current code block will send fifty-percent of the available energy to the motors. It will send this amount of energy for one second. That isn’t much time. We will change these values later.
STEM Integration
Let’s take a closer look. The code here relates to some basic concepts in science. The mBot has a battery pack. It uses four double-A batteries. Each battery is 1.5 volts. There are four of these batteries. That is a combined voltage of 6 volts. Volts are potential energy. Potential energy is a concept covered in physical science.
The code block instructs the micro-controller to send fifty-percent of this potential energy to the motors. The energy is released as current. Current is the flow of electrons from one end of a circuit to another. We can determine the current sent to the motors with a math formula. This formula is taken from
Ohm’s law. Ohm’s law is a formula used to calculate current, resistance, or voltage in a circuit. To determine the current sent through a circuit, we divide the voltage by the amount of resistance in a circuit.
We don’t need to know the exact amount of current sent to the motors. It is enough that we use this moment to apply classroom concepts to real-world applications. We must use the proper academic language.
Through the use of this model, we show students potential energy at work. They understand that the current is flowing through the motors to move the robot. They understand that one form of energy is being converted into another form.
There is another concept that we can teach with math and science. That concept is time. Using the code block, we send current to the motors for one second. We will change this value later to something more reasonable. It is important to note that the code does not have instructions for values that relate to miles per hour or even feet per minute. The values have nothing to do with the measurement of distance.
The values relate to energy and time. These two concepts are closely related to concepts taught in astronomy, physical science, and math. In space, distance is commonly measured in time. For example, the distance from the earth to the sun is 92.96 million miles or 146 million kilometers. Light takes 499 seconds to travel from the sun to the Earth. We call this One Astronomical unit. Light travels at 186,287 miles per second or 299,792 kilometers per second.
There are lots of numbers used to describe the distance from the Sun to the Earth. We can easily get confused when using miles or kilometers. How do we know the sun is that far away from the Earth? Did someone travel there to measure? Did we have a very long measuring tape? We used the constant speed of light to help find the distance. For the most part, light always travels at the same velocity. It is the same almost everywhere we measure. Light is constant. This makes the use of light a reliable measuring tool.
Light is measured in the amount of time it takes to travel from one place to another. The Sun is 499 light seconds from the Earth. The distance to the closest star system is 4.22 light-years. That is about 25 trillion miles or 40 trillion kilometers. A trillion is a number followed by 12 zeros. Time might be easier to understand.
We measure distance in time all the TIME! How long does it take to travel from your city or home town to another city? When children are fussing in the back seat they don’t ask, how many more kilometers ’til we get home? They as when are we getting there. They are already measuring distances in time.
Time is a central part of calculating velocity and acceleration. To determine velocity and acceleration we need a change in time and a change in position. The change in position is the distance traveled from one point to another. The calculation of force requires the calculation of acceleration. Acceleration is part of velocity.
We have strayed far away from the code for the robot. That is part of the point. We can extend and integrate a variety of concepts when using robots for STEM. Coding the robot is a means to an end.
Returning to the code
Let’s get back to the code block. This simple code instruction will help students learn and understand some principles of motion. Students will adjust the code parameters to learn and understand velocity and acceleration.
Update the code block so the mBot travels at half the potential energy for 3 seconds.
To upload the code we need to go through a few steps. Connect one end of the USB cable to the mBot. Connect the other end to the USB port on your computer. Turn the mBot ON. Make sure to hold the mBot. Sometimes the mBot wheels will begin to spin. My students often lay the mBot on its back. This leaves their hands free to work with the application and the upload process.
The mBot wheels will roll because it begins to process the instructions in any code uploaded to it from a previous session. The code is saved in the mCore memory. The code in this memory is executed each time the robot is turned on. This is common with devices that have Microcontrollers. The code is cleared out by new code uploaded or by updating the Firmware.
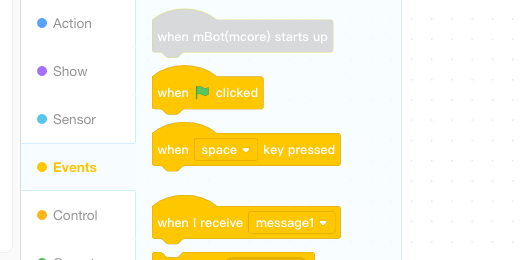
Click the Events category. The code blocks in this category are used to start our instructions. These are conditions that need to be met before the mBot will begin executing the instructions. Some of the conditions include the clicking of a green flag and the press of the space key. These conditions are often used with Scratch and the development of interactive stories and games. These conditions don’t work well with our robot.
The condition block we need is the first one. When mBot(more) starts up. This block is grey. This means the block cannot be selected. We cannot add it to the canvas while it is grey. How can we select it then?
We are currently in test mode. Test mode does not actively connect to the mBot. We need to exit Test mode.
Go to the bottom of the application and look for the Connect button. Above the button is an option for live or upload mode. Click the switch to change to upload mode.
The mBot condition block is now available. The condition blocks for the Scratch development environment are grey. This means they are not available for our robot.
Attach the mBot condition code block to the move code on the canvas.
We need to open a communication link to the mBot from the program. This will allow us to upload the code to the robot. Go to the bottom of the application and click the Connect button.
Uploading is when we send content from our computer to another. We download when we get content from another computer.
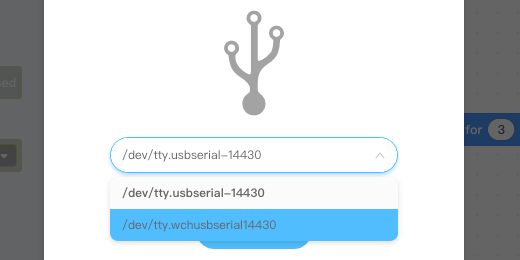
A connection configuration box will open. This configuration box is used to select the USB communication port connected to the robot. The port will be different on Windows and Mac computers. The image below shows the connection port on a Mac computer. The connection is being directed to one of the USB ports.
The connection port on Windows is usually Com3. It can also be Com1 or Com2. Com stands for Communication.
Click the port selector. The available communication ports will be listed. The communication port for the mBot on Mac has a special name. This port is /dev/tty.wchusbserial. The number after the name will depend on your Mac. The important part of the information is “wch”. This identifies the port that communicates with the mBot. Select this port.
Click the connect button.
A new button appears below the Test button. The connect button changes to Disconnect. Above the Disconnect button is a button to upload our code to the mBot. Click the button to begin the upload process. Make sure the robot will not roll off a table before doing this!
The mBlock software will compile our instructions. This means the program is checking our instructions for mistakes. It is also converting our instructions into instructions the mCore board understands. The compilation process is both a code checker and a translator.
The instructions are uploaded after the compilation process is complete. A progress bar will show the upload progress. The upload is usually quick. The mBot will run our instructions once the upload is complete.
Turn the robot off. Unplug the cable from the mBot. Leave the other end connected to the computer. We will be returning often to update the code. Each time we update the code it must be compiled and uploaded.
Set the robot on the floor and turn the power switch On. The robot will run the code again. It will do this every time we turn the mBot On.
Customize Sway with Themes
Presentations in Sway are theme-driven. The choice of colors and fonts is limited. This is done in part to reduce the amount of work that needs to be done to produce a polished presentation.
Themes and design
Presentations in Sway are theme-driven. The choice of colors and fonts is limited. This is done in part to reduce the amount of work that needs to be done to produce a polished presentation. A theme is selected for us during the creation of a sway.
In the previous lesson, we created a presentation on the exploration of Mars. The theme for the project is based on the images. The theme for this project is nice but I would like something different. Go to the button bar and click Edit.
Click the Design tab.
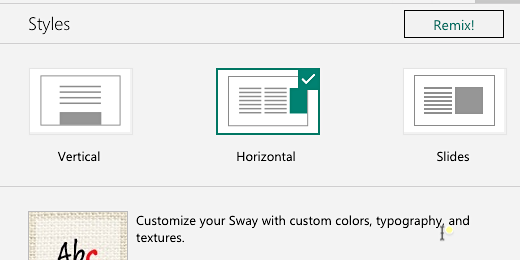
Click the Styles button.
The first option in the Styles panel is the display format. This Sway is set to display the information horizontally. Users will swipe left and right to view the presentation. The vertical option displays content like a traditional web page. The Slides option presents content much like a traditional slide show. We’ll keep the horizontal option for now.
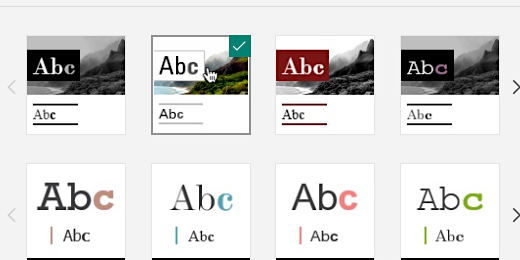
There are several thumbnail samples of themes. Each sample includes a variety of colors, styles, and fonts. Click the first theme thumbnail.
The Sway project updates to match the theme we selected. This theme changes everything to black and white. I'd like to keep the color of the images.
I’ll select the next theme thumbnail. This restores the image colors.
There are other ways to customize the presentation design. Click the Customize button.
Sway uses images in the project for a color palette. The curated palette can’t be changed. Click on one of the other image thumbnails. I’ll click on the mars rover thumbnail.
The color palette options update with suggestions. I’ll click the dark color option in the extreme right.
The image gets a little darker and the background for the text gets darker too.
That’s too dark. I’ll select a lighter option.
There are a few font options. Click the font choices selector.
Select a font option. See how it looks in the project. Select another until you find one that works.
This is looking much better. Click the Play button to preview the project.
It’s looking much better. I would like to keep the images separate. To keep them separate we need to change the presentation mode.
Click the Edit button.
Click the Back button.
Click the Slides option and preview the project.
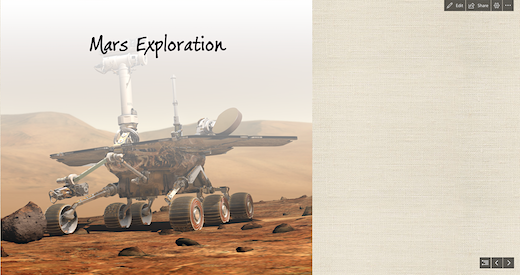
The rover image is all by itself on the first card.
Use the navigation controls to move between cards.
The images look very nice. The text on the cards is a little too plain.
Click the Edit button. The button bar might disappear when previewing. Move the mouse pointer to the top right so it reappears. Click back on the Storyline section.
Click the triangle to reveal the contents for Galileo.
Click inside the first text card. Select all the text in the card. Click the Emphasis option.
Repeat the process for text on the next card.
Click the play preview button. Navigate to the text card. The text looks nice but it is still lacking something. Go back to edit mode.
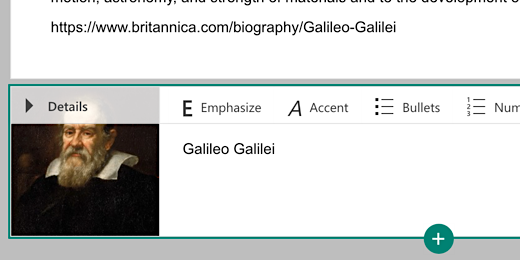
The text cards are on their own. We can group text cards with images to add interest. Add an image card below the second text box. Add an image of Galileo to the card. Make sure to include a caption.
Click the Play preview button and navigate to the information cards. The text from the cards appears to the left of the image. The image is on the right because it is the last card in the group. To place the image on the left side we need to move the image to the top of the current group.
This looks much nicer. Look at the rest of the project. The last two cards include the video and Mars facts. The Mars facts are on their own. They didn’t group with the video card. There is an option to force group cards. Go back into edit mode. Find the Mars video card. There is a box in the lower right corner of the card. Place a check in the box.
Go to the card with the Mars facts and place a check in that box too.
A group option becomes available on the text card above the text area. Click the Group button.
The grouping places the cards to the left and right of each other. The Grid option arranges the cards from the top down then to the right. Leave the Automatic option selected. Click the Play preview button.
The video and text are placed next to each other.
Formatting text
Our text needs some formatting. Go back into edit mode. Go to the Mars facts card.
Click once in front of the first sentence and press the Return key once. This will move the text down. We will add a title to the top of the facts information. Type Mars Facts.
Highlight the Mars Facts text and click Emphasis.
Highlight the Mars Planet Profile text and emphasize it too.
Click the Play preview button. Click the Outline view button. The button is next to the navigation arrows.
Click the Mars thumbnail.
Click the right navigation arrow to get to the video.
These are some of the fundamentals. I use this for my introductory project with students. Students continue to add information from their research.
Student presentations with Microsoft Sway
In this lesson, we learn to use Microsoft Sway basics. We create a basic Sway product with images, videos, and text. Microsoft Sway accesses a variety of resources on the Internet to help develop our project. Follow the step by step instructions to create your own Sway products.
Microsoft Sway
Sway is a free online product from Microsoft. All you need is an Outlook email account. Sway is a storytelling app that presents itself as an alternative to PowerPoint. It presents concepts quickly, easily, and clearly.
Sway is cloud-based. This makes it easy to collaborate on Sway projects. It is also easy to share projects with the world.
Sway is built to tell stories. It uses cards to gather concepts in the form of images, video, and text. Cards are grouped to combine concepts similar to paragraphs in a narrative.
Themes take the guesswork out of designing backgrounds and selecting fonts. This is a definite plus. My students often spend too much time selecting colors and fonts. I would rather they spend time developing content. There are plenty of theme choices.
Import a variety of media to create a nice visual presentation. Images and videos can be imported from online resources. Searches for online content are filtered for media in the Creative Commons. This assures that content does not violate copyright. It is easy to add content from a variety of other sources. These sources include OneDrive, Google Drive, Flickr, and our device.
Pull in existing PowerPoint presentations and Word documents. For best results, documents should be formatted with proper headings.
A browser is all we need. Sway presentations work on any device.
Creating A Sway
Sway is available online and is free to use. All that is needed is an email account. Schools with children under 13 can use district accounts. Microsoft provides Office 365 resources for Eduction.
The easiest way to access Sway is to type https://sway.office.com in a browser's address bar. Click the Get Started button or click the login button at the top of the page.
Templates are available to help get started on a project. These templates are a good way to understand what Sway does. I encourage you to view some of these templates.
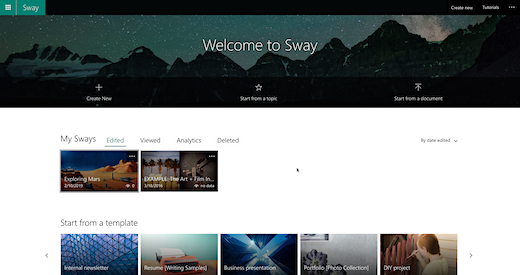
The Sway home page provides some examples. These projects are a good way to learn what is possible with Sway. They are developed by others in the Sway community. The projects in the community have a professional look and feel. Sway makes it easy to create nice products without too much effort.
The banner area of the home page has three options. The first option on the left creates a new empty project. This is where we will begin in a moment. The center option is similar to using a template. We start with a topic. The topic uses keywords to gather resources from Wikipedia and develop an outline for a project.
The third option located on the right begins with a document we created in Word or PowerPoint. Sway uses the content in these documents to develop a Sway outline. This is a helpful way to convert existing PowerPoint slides to Sway projects.
Mars Exploration Sway
We will develop a project where students have researched the exploration of Mars. The exploration will begin with the history of its discovery and documentation by Galileo with his telescope. The research will take us to the most recent explorations with satellites and robots.
We will begin with a new empty project. This way we can see how different media and content are added. Sway uses cards to organize and present content. This is similar to PowerPoint slides. Each card contains a media element. These elements include images, text, video, and audio. Click the Crete New button.
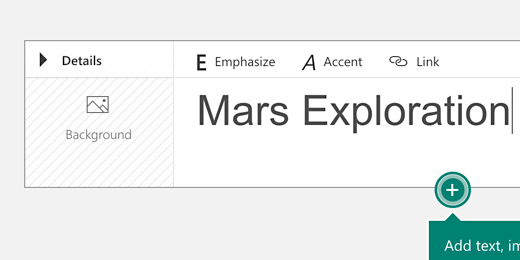
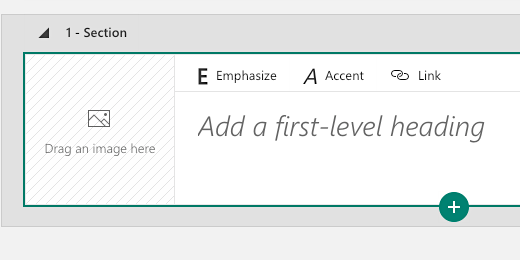
We are presented with the first card in our Sway project. The card is a title card. Enter the title "Mars Exploration".
To the left of our project title is a place for us to include a background image for the card. Click once on the background place holder.
A panel opens on the right side of the project page. This panel provides suggestions for background images based on the title of our project. Click the Mars Exploration suggestion.
The panel displays a variety of images related to Mars and Mars exploration. The top of the panel includes a section for images and videos. We are currently in the images section. All these images and videos are covered by the Creative Commons license.
There are a variety of images on the internet. Many of them are of good quality and others are not. It is usually best to select images that are of the best quality possible. This is especially true for background images. Background images will need to stretch out across a web page on small and large displays.
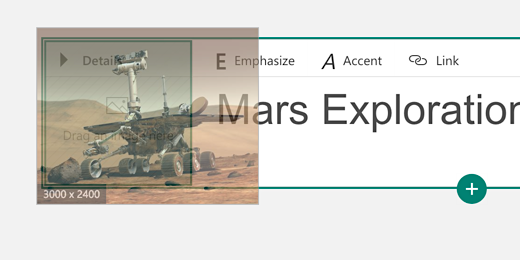
The resolution of each is shown below the image. The image with the largest resolution is in the top right. It has a resolution of 3000 by 2400 pixels. The image with the lowest resolution is 500 by 500 pixels. Click once on the image with the highest resolution.
During the selection of the image we learn about image resolution and how to gather images with good resolution.
Click the Add button.
We can also drag and drop the image onto the placeholder.
We have just created our first card. To create additional cards we click the plus button on the bottom of the current card.
A box with several menu options appears. Sway cards work best when they have a top-down order. The first card in our project is a title card. Our next card should be a heading. There are two types of headings. Heading 1 is used after titles. It is referred to as a first-level heading. Heading 2 is used after heading 1. Click the Heading 1 option.
The heading 1 card is similar to the title card. The first heading in our presentation will provide information on Galileo. Type Galileo Galilei in the first-level heading box. Galileo was the first to observe and document Mars with a telescope.
Go to the media panel and type Galileo Galilei in the search box.
A variety of images for Galileo appear. I want a high-resolution image. Use the one that has a high resolution and works with the presentation.
Discuss choosing images that relate best to the content. We look at several images and discuss why they might or might not be the best choice for our project.
There is more to Sway than images and headings. Sway provides a nice way to display written information.
Click the plus button below the Galileo card and select the text option.
Add some text in the card related to Galileo.
Information for the text is gathered with the class before we begin to create our project. This reinforces the importance of content as the driving reason for the project.
Let’s add another card. This card will provide basic information on Galileo.
Let’s take a look at what we have done so far. The heading 1 card and each text box are grouped within a larger box. This grouping is helpful when we develop large Sway projects. Grouping is useful when students are working collaboratively. Each student can produce a group of information cards.
The heading card has a triangle to the left of the title. This triangle collapses a grouping.
Collapsing groups helps when working on large projects.
Create one more grouping. Create a new card and select the heading 1 option. Title the card Mars the Red Planet.
Click the background option. Select the Mars recommendation in the suggested searches panel.
Find a nice image for the background.
Add a little more interest to the Sway presentation. Click the videos section.
Look for a short video. I found one from National Geographic. This video is a little over three minutes long.
Discuss why the length of a video is important in a project. Bring in discussions of the audience and their expectation. Have a conversation over how to balance our need to present information and the audience need to be informed and entertained.
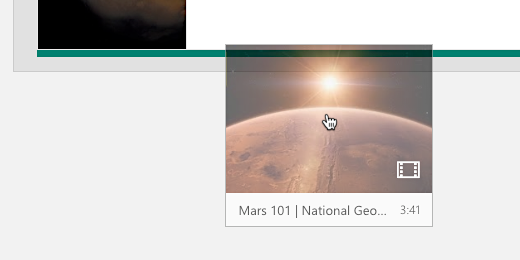
Click and drag the video below the current card.
A new card is created with the video. The card includes an option to include a caption. This caption appears above or below the video. The location depends on the theme. The caption for the video will credit the source.
Discuss the importance of citation in any publication.
Type National Geographic in the caption box.
Click the plus button and add a text card. This text card will provide basic information and data on Mars. The bottom of the information text contains a link to the source for citation.
Preview the project by clicking the Play button. The button is in the button bar at the top of the page. Go ahead and create your own Sway presentations. All Sway products are saved and stored in your Microsoft Cloud account.
Tinkercad Transistor circuits
Transistors and LEDs have revolutionized our modern world. Transistors have made fast and small computers possible. In this lesson, we will learn to use the transistor as a switch.
Transistors
Transistors and LEDs have revolutionized our modern world. Transistors have made fast and small computers possible. In this lesson, we will learn to use the transistor as a switch.
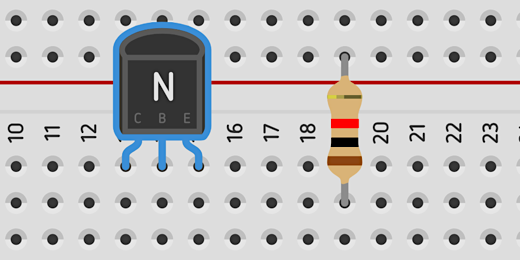
Transistors have three leads. Each lead has a name and a purpose. The center lead is called the Base. The leads on either side are called the Collector and Emitter. You will see an image of this transistor later in the lesson. The location of the emitter and collector depend on the type of transistor being used. There are two types of transistors. Each transistor is referred to as either a PNP or NPN transistor.
The difference in the type of transistor depends on how it is manufactured. The NPN transistor is the most popular and common. Each end of the transistor is made of a semiconductor material that is saturated with electrons. The center material is depleted of electrons. This positively charged layer is sandwiched between two negatively charged layers. This is the transistor we will use in our lesson.
The PNP transistor is not as common. This transistor has a negatively charged layer sandwiched between two positively charged semiconductors.
For the transistor to work as a switch the base must receive electric current. The current stimulates the base to allow the flow of current across the collector and emitter. We typically have two power sources for a circuit with transistors. One power source activates the base and another source powers a component. Our first project will have one power source. The first project will help us compare how the second project with two power sources differs and the advantages of having two power sources.
Switches
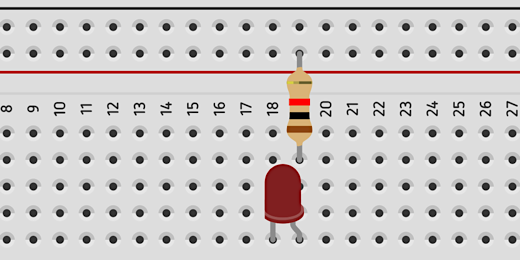
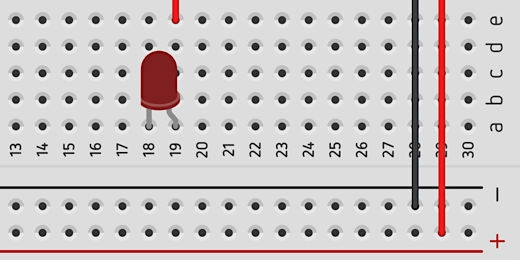
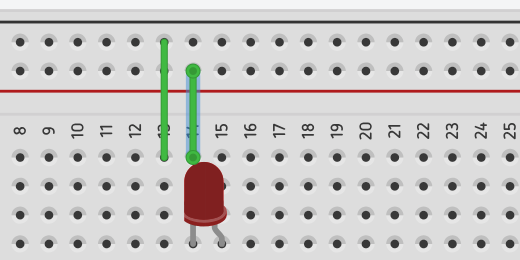
For this project, we will need a breadboard, LED, resistors, button, and transistor. Create a new project. Place a small breadboard onto the work area. The first step is familiar. Attach a resistor to the board. One end connects to the positive rail. Add the LED so the Anode is on the same connection as the resistor. The current must flow into the LED through the Anode lead.
This circuit is going to have a few more components than our other circuits. I want to have plenty of room to keep things easy to see. Move the LED to the other half of the breadboard. Place it on the bottom of the board.
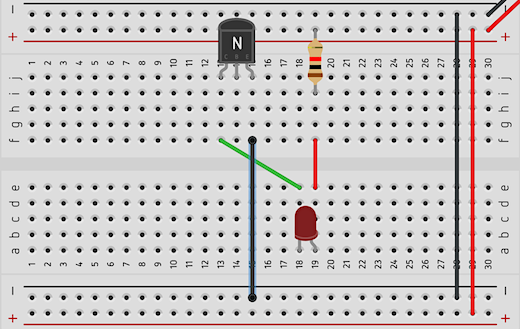
Use a jumper wire to connect the resistor to the Anode on the LED.
Get a 9-volt battery and attach jumper wires to the top half of the board.
We are using the lower half of the board too. Run jumper wires from each rail in the top half of the board to the lower half.
In the LED circuit, we placed a push-button between the Cathode and the negative rail. We are going to do the same thing here but we will use a transistor as our button to close the circuit. Find an NPN transistor in the components panel. It’s in the basic set of components.
Place the transistor in the top half of the board next to the resistor. A transistor has three parts. It has a collector, base, and emitter. The transistor on our board has the letters C, B, and E to help identify the parts.
Connect a jumper wire from the Cathode on the LED to the Collector on the transistor. The Collector is labeled with the letter C.
Circuits run in loops. To complete the loop in this circuit we need to connect a jumper wire from the emitter to the negative rail. The transistor is large like the capacitor in our previous lesson. Instead of moving the transistor to attach a jumper wire we will attach it to the bottom of the board.
We don’t have a complete connection yet. Press the Start Simulation button. The LED doesn’t light because we don’t have a closed circuit. We need to pass current into the base of the LED to close the circuit.
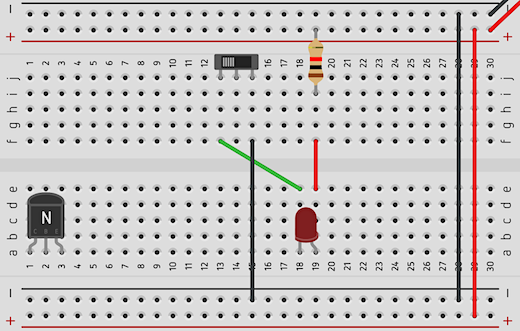
Let’s take a moment to see how this circuit resembles a previous circuit. If we replace the transistor with a switch it looks like one in a previous lesson.
This is the part that makes it all work. Connect a resistor to the base of the transistor. The resistor will connect with the lower half of the board. Connect a jumper wire from the other end of the resistor to the positive rail. The current running from the positive rail through the resistor and base of the transistor is what activates the transistor.
Press the Play Simulator button. The LED will light.
The current flowing into the base of the transistor is what causes the transistor to close the circuit.
At this point we have a discussion noting the similarities and differences between a transistor, push-button, and switch. We discuss how the transistor is like a push-button and how it is like a switch.
Students have discussions in small groups. They discuss when a transistor as a switch would serve better over a regular switch. What are the advantages and disadvantages of using a transistor as a switch in a simple circuit?
Title the circuit Basic Transistor circuit and click the Tinkercad icon to return to the Tinkercad Circuits page.
This basic transistor circuit uses one power source to activate the transistor and light the LED. Let’s take a look at a circuit where we use a smaller current to pass a larger current to a circuit.
Amplification
The circuit for this lesson is similar to the one in the previous lesson. We don’t need to recreate the whole project. We will be using many of the same components.
We’ll make a copy of the previous circuit and use it for the next. Hover your mouse over the circuit preview of the previous project. Click the gear icon that appears in the upper right corner.
Select the Duplicate option.
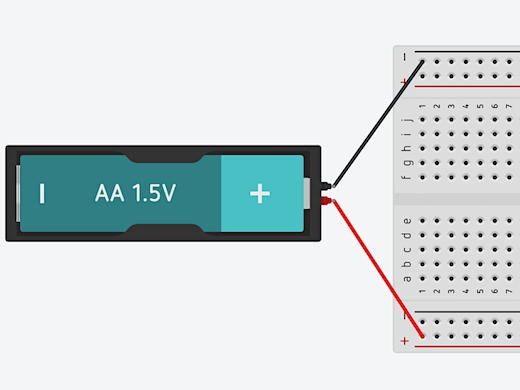
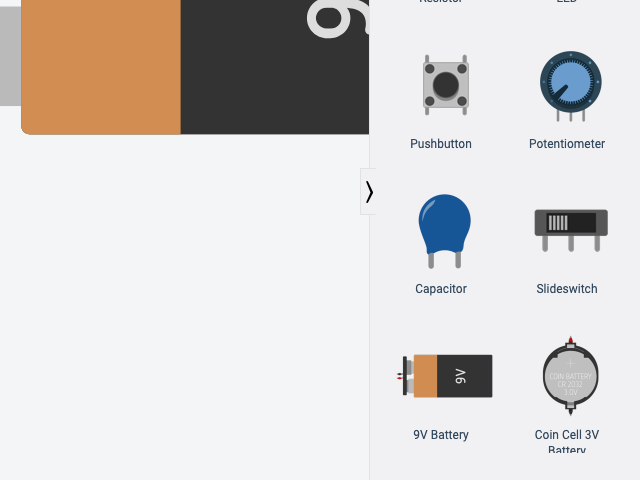
A copy of the circuit will be created and opened. The first thing we are going to do is replace the 9-volt battery with a AA battery. Click once on the 9-volt battery and press the delete key on your keyboard. Find a 1.5 volt AA battery and place it next to the board.
The terminals on the battery are at a right angle to those on the breadboard. I like to rotate the battery so the terminals are parallel.
There is a rotate button in the button bar next to the trashcan icon. Clicking the button will rotate a component clockwise. Make sure the AA battery is selected and click the rotate button once or twice. We need to do a lot of clicking to rotate the battery in this direction. Hold the Shifty key on your keyboard when clicking the rotate button to rotate counter-clockwise.
Connect the terminals to the board with jumper wires. The terminals don’t align so the wires will cross. This is where color-coding helps.
We reduced the voltage of the battery. In doing so we reduced the amount of current going to the circuit. Press the Start Simulation button to see the result on the LED. The light from the LED is fainter.
Stop the simulation and get another 1.5 volt AA battery. Place this battery on the opposite side of the board. Rotate the battery. Connect one jumper wire to the negative rail at the top of the board. Connect another jumper wire to the positive rail at the bottom of the board. This battery will serve as the source for the Base of the transistor. It will trigger the switch to allow current to flow through the transistor and circuit.
This battery provides the power source for the transistor base. We don’t need the power from the other battery yet. Remove the jumper wire connecting the battery on the right side of the board. Leave the wire for the negative connection. We still need a ground connection for the emitter.
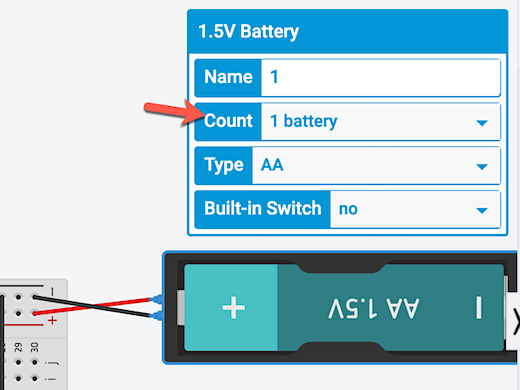
We want the LED to shine brighter so we need more current. To get more current we need more potential energy in the form of volts. Click once on the 1.5 volt AA battery on the right side of the board. The configuration panel for the battery shows a count of one battery.
Click the battery count selector and choose 4 batteries.
Click the Start Simulation button. The LED is much brighter now.
Click once on the battery on the left side. Go to the configuration panel for the battery. Change the built-in switch option from No to Yes.
The battery will be enclosed in a case with an ON/OFF switch. Click once on the switch to turn the battery current OFF. This battery supplies current to the transistor. When current from this battery stops, the current to the transistor stops. This opens the circuit and prevents the current from batteries on the other side. No current means our LED won’t shine.
Circuits with Capacitors in Tinkercad
A capacitor is much like a battery. It stores current and releases that current when a circuit is closed. They don’t store as much current as a battery. Capacitors are reliable and don’t need to be replaced like batteries.
Capacitors
We will build on the skills we learned in the LED circuit. This circuit uses a capacitor. A capacitor stores current and releases it at a steady rate. The current in a circuit can change with power fluctuations, which can damage sensitive circuits. Capacitors are used to smooth out the current supplied to components and gradually reduce the current supplied to a component.
A capacitor is similar to a battery. It stores current and releases it when a circuit is closed. However, unlike batteries, capacitors don’t store as much current. Nevertheless, they are reliable and don’t need to be replaced like batteries.
This is an excellent time to discuss potential energy and kinetic energy. Batteries and capacitors store electricity, which is potential energy. The stored energy is released into circuits and provides kinetic energy. The amount of kinetic energy released is measured as current. The potential energy in batteries is measured in volts.
The potential energy in capacitors is measured in Farads. Capacitors store electrostatic charge. They don’t produce the current released. They store it and release it at a steady rate.
This resource has been relocated; use the link below.
Buttons and switches in Tinkercad circuit projects
Buttons and switches are used to complete circuits in electronic components. Tindercad has buttons and switches to close circuits in our simulated electronic projects.
Buttons in an LED circuit
A switch or button is used to close a circuit. Current in a circuit flows from the positive side of a power source to the negative side. A closed-circuit is required to enable the flow of electrons from the positive side of the battery terminal to the negative side.
We’re going to build on the same circuit from the previous article, A Basic LED Circuit with Tinkercad.
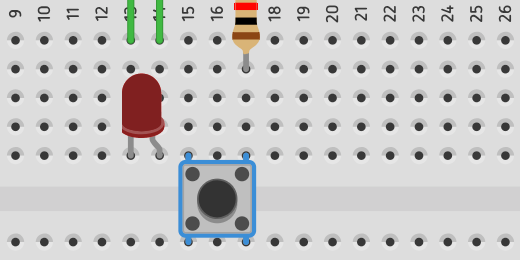
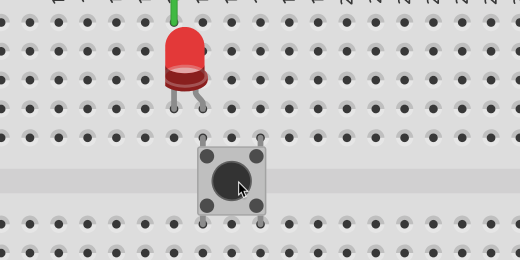
Go to the Components panel and look for the push button. It has a circle in the center of a square. Place the push button on the right of the LED. We will use the button to bridge the center division of the breadboard. Half of the button should be on one side and the other half on the other.
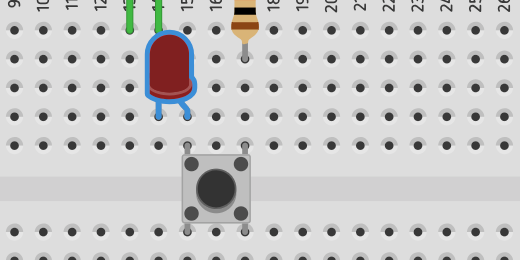
We need to move our components around the board to complete the circuit. Move the LED so the Anode lead is on the same row as the lead for the left side of the switch.
Move the resistor to the other side of the board. Align the resistor to the right lead of the push button. One end of the resistor needs to connect to the positive rail on the board.
We need to reposition the two jumper wires. The jumper wire that connects to the LED Cathode lead needs to connect to the negative rail.
Click once on the jumper wire. Circle handles appear at each end of the wire. Use the handle on the positive rail to move the end of the wire to the negative rail.
Click once on the jumper wire to the left of the one we positioned. Click and drag the top of the wire to the right.
Place the wire near the jumper wires for the battery. Connect it to the positive side of the rail.
Move the other end of the wire to the other side of the board and connect it to the positive rail too. This is how we distribute current to both sides of the board when using one battery.
jumper wire across breadboard
Let’s take a closer look at the push-button connection. Think of the button like a road with two lanes. Current flowing in each lane will flow uninterrupted. The current flowing through the right lead is not prevented from flowing through the button. The current cannot go to the other lead, the one on the left, unless the button is pressed. Pushing the button closes the circuit and current flows from the right lead to the left lead. Like a car changing lanes.
Press the Start Simulation button. Press the push button with your mouse to light the LED. Keep the button pressed on your mouse to keep the LED light. Release the button to turn OFF the LED. The LED remains light as long as we keep pressing the button.
Using A Switch
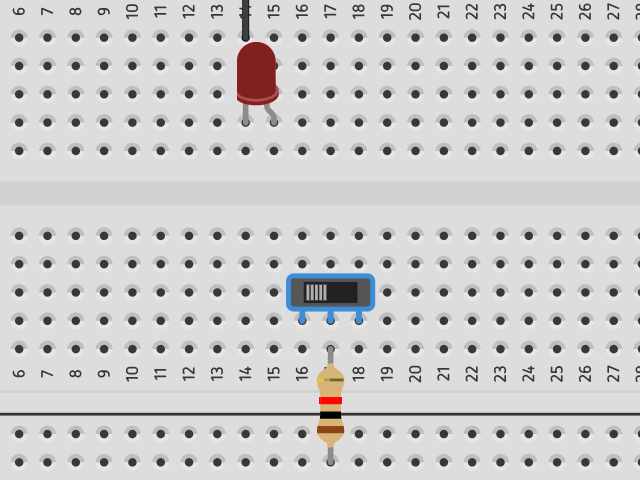
A switch is an option to light the LED without keeping our finger or the arrow on the push button. We’ll replace the push button with a switch. Click once on the push button and press the delete key on your keyboard. If the button isn’t removed, make sure the simulator is stopped. Go to the Components panel and find the switch.
Place the switch on the board. Place the center lead of the switch in the same row as the resistor. Place it in the column above the resistor.
The center lead on the switch is called the Common. This is where the current flows into the switch.
The leads on either side of the switch are called terminals. The lead on the left is called Terminal 1. The one on the right is called Terminal 2.
Connect a jumper cable from Terminal 1 to the Anode on the LED.
There is a slider on the switch. The slider is currently connecting the Main to Terminal 1. This is creating a closed circuit. Click the Start Simulation button. The circuit is closed and the LED will light.
Slide the switch to the right to turn the LED OFF.
Basic LED Circuit with TinkerCAD
TinkerCAD has a circuit development environment along with a simulator. The components are similar to actual components. This allows us to teach basic electricity and electronics concepts.
Introducing Tinkercad
Tinkercad is an online development tool for 3D models. It is also a development tool for electronic circuits. The development environment is easier to use than similar tools used by professionals. It’s intuitive for students. The lessons in this article will focus on the electronic circuit development environment. This environment has components to construct a variety of electronic circuits. We assemble and test these circuits inside the development environment.
There are many benefits to using an online development and simulation environment. The service is online so there is nothing to install. There is no specific browser requirement. The service is free. The components don’t break. We are free to make mistakes. The environment is safe. We don’t have to worry about students sticking themselves with the points of LEDs or transistors. No electronic shock from battery current.
A drawback is that the development and testing environment is digital. Studies have shown time and again the importance of kinesthetics. Kinesthetic learning is where students interact with their learning by touching and interacting with objects. Students are engaged in active learning.
In my experience, students learn better when they interact with the content. Using an online simulation is not enough. The online skills don’t always transfer from the simulated world to the real world. There are lots of reasons for this and one reason is the lack of context. Learned skills must be applied to real-world situations.
I recommend combining the online development of circuits with hands-on activities using real components and circuits. Electronic circuits are relatively inexpensive. A box of 300 LEDs on Amazon costs as little as $9 US dollars. A box of over 500 resistors costs about the same. An assortment of capacitors costs about 13 dollars. A pack of six mini breadboards runs about $5. Keep in mind that these are all reusable and can last years.
Find an old radio in a second-hand store and open the back. Expose the electric components. Don’t plug the radio to a power source when doing this. Remove any batteries too. Identify the components and discuss their purpose.
Studying the components in a circuit ties in very nicely when discussing systems. How do the components contribute to the functioning of the radio? How would the removal of one component affection the functions of the radio? How is this similar to other systems?
Login to the Tinkercad Circuit Environment
Tinkercad is free. Creating an account requires an email address. Students in districts with account integration through Google or Microsoft can log in with one of these accounts. The login option for Google or Microsoft is not immediately apparent. Let’s take a look at the process. Click the Sign In button.
Select the option to sign in with a social media provider account.
Select the Google or Microsoft login option.
Sign in with your email account credentials. If you are using a Google account and the Chrome browser then you will be presented with your account information. Click the account you want to use. Most people have one account. You might have multiple Google accounts. Just select your favorite.
The Tinkercad home page appears as soon as you log in. The home page begins with the 3D development environment. There is a menu on the left side of the page. Use this menu to navigate to the Circuits development environment.
The Circuits portal has a nice big green button. Click this button to create a new circuit.
The Circuit Simulator
The circuit simulator is simple. The main area has a development canvas. All the available components are found in a panel on the right side. There is an extensive list of components. The basic components are displayed for us to create basic projects. Some of these components include LEDs, switches, resistors, and batteries. There is a search box above the component list. The search box is useful when we need to find a specific component in the much larger list of components.
There are four buttons above the list of components. One of the buttons is used to start the simulation after we construct a circuit. When everything is ready we press the Start Simulator button. This activates the simulated battery current. We need to press this button to begin the simulation every time. We need to stop the simulation when we want to make any changes to the circuit. Like in real life, we should not work on a circuit when current is flowing through it.
The Breadboard
A breadboard is used to develop circuit prototypes. It provides a place for us to connect components and hold them in place. Without a breadboard, we would have to connect components with clips or bare wire. These are not ideal ways to connect components. The breadboard makes the job of creating circuits much easier.
The term breadboard comes from the early days of electronics and prototype development. Hobbyists would use screws and nails on old breadboards to hold components and wires in place. Breadboards were made of wood. The breadboards used for electronic prototyping today are made from a plastic case. Inside the case, we have metal clips that hold components and wires.
For those of you that don’t know. A breadboard was at one time used to slice bread. This is when you made your bread or purchased bread at a bakery.
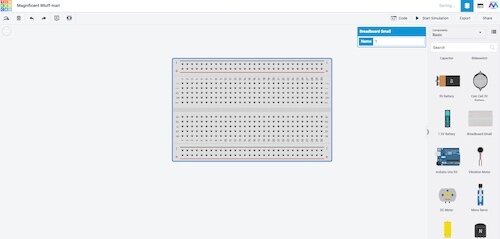
Before building projects on a breadboard we should find it in the components panel and place it on the work area. Scroll down the list of components and find the small breadboard. Click and drag the board onto the work area. We can also click the board once and it will attach itself to our mouse pointer. Place the board near the center of the work area.
Let’s take a closer look at the board. We must understand how the board works. The board is a plastic rectangular box. The box has holes placed in patterns.
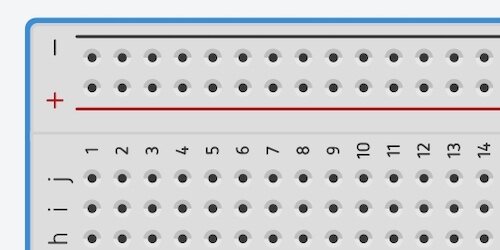
There is a series of holes between red and black lines. These holes are on opposite ends of the breadboard. The end of each line has a Plus or Minus symbol. The plus is red and the minus is black. These colors are important. They are a standard used by most circuit designs. The holes along the red line carry current from the positive side of a battery terminal. The holes along the black line carry current from the negative side of the battery terminal.
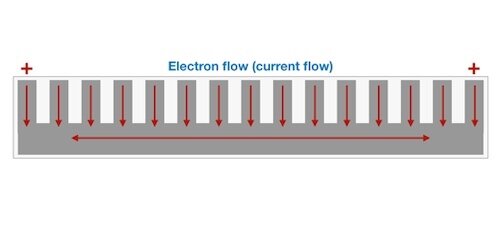
Let’s take a look at what is going on inside a breadboard. Under each of the holes is a metal clamp. This clamp holds the wires we insert into the holes. The clamps are all connected. We can use any hole to pass current to any of the components. In the diagram, I am showing that voltage is flowing in from the positive terminal. The current can flow in from any of the holes on the board. The current is distributed to all the other clamps. Once we connect a component, the current flows up the clamp and into that component.
We are accustomed to thinking that electric current flows from the positive terminal of a battery to the negative terminal. Electric current does flow from the positive terminal to the negative but the concept is backward. Electrons flow through circuits. Electrons have a negative charge. Electrons flow toward the positive end of the battery.
When electric current was first discovered it was thought that electric current had a positive charge. We later found that an electric current has a negative charge. By that time it was too late and the symbols for current flow have remained the same for most people. The positive battery terminal is filled will electrons flowing out and going to the negative end of the battery which is filled with protons. Protons have a positive charge.
Here is another sliced look at the breadboard. This view shows the positive and negative buses on both sides. A bus in electronics terms is a metal conductor that transfers electric current to components. Each positive and negative connector is a bus that transfers current to each component that touches any point on the bus.
The holes and clips between these two rails work much the same way. The difference is that the clips connect horizontally. The holes in the center are organized in a grid. The columns are labeled from A to J. The rows are numbered from 1 to 30 on this board. This is a small breadboard.
There is a divider running down the middle. This divider is there so we can assemble multiple projects on one board. We can assemble a project using columns A through E and anther using columns F through J. We can bridge this gap using a jumper wire. We will talk about jumper wires once we begin working on the first project.
The best way to learn how a breadboard works is by using it to develop projects.
Basic LED Circuit
The basic LED circuit is my favorite when introducing circuit projects to teachers and students. It provides a good introduction to the basic layout and components in Tinkercad. The circuit is simple and familiar to most people. I used to make flashlights when I was a child.
Basic and advanced components are located in the right panel. Some of the basic components include LEDs, switches, batteries, and resistors. They form the basis of a simple LED light switch. LED stands for Light Emitting Diode. A diode is a component that permits current to flow in only one direction. Current flowing through an LED emits light.
The LED is one of the first components in the list. Click the LED component once. It will attach itself to the mouse pointer.
Move the mouse pointer and LED over the breadboard. The Leads on the LED will want to attach themselves to the holes in the breadboard. Place the LED near the center divider. Don’t worry about placing the LED in the same location like the one shown in my image. There isn’t anything magical about the location where I placed the LED.
Leads on a component are the wires used to connect to other components. Leads in our components will attach to the breadboard rails.
The difference between an LED and a light bulb is important. The differences provide a good opportunity to teach a few concepts. A light bulb uses a filament to generate light. Light is emitted when the filament heats up. It heats up because of current going through the filament. The filament is made of impure metal. This impurity facilitates the flow of electrons and the resistance of electrons at the same time. There is enough resistance to cause heat and light but not so much as to prevent current from flowing through the bulb. It is the resistance that causes the filament to heat up. The heat generated causes the filament to glow. The glow is what provides the visible light we see.
An LED is different from a light bulb because it does not use a filament. It does not rely on resistance to generate light. It uses a semiconductor to facilitate the flow of current. The semiconductor consists of two materials. One is called a P-type semiconductor and the other is an N-type semiconductor. Sorry, we got real technical real fast. It’s okay the purpose is not to understand LED here.
They are assembled inside the plastic container. Electrons flow through the negative side of the LED and excite the electrons on the N-type conductor. The negative conductor. These electrons flow across to the other side with the P-type conductor. The positive conductor. There are holes in the P-type connector where the electrons are forced to flow. The holes are smaller than the electrons. To go through these holes the electrons must lose energy. This energy is given off in the form of photons. Light is composed of photons.
Light bulbs use resistance to generate heat and light. LEDs don’t use resistance. This is why they are cooler than light bulbs and use less energy.
The Resistor
LEDs don’t use lots of energy. They also don’t have much resistance. The typical LEDs we use in a project like this one are sensitive to too much current flowing through them. We need to control the amount of current flowing through an LED. To control the flow of current we need to use a resistor. Select the resistor component and move it onto the breadboard.
The placement of the resistor is important. The LED has two Leads. One of the Leads is bent. This lead is called the Anode. The other Lead is called the Cathode. We send current through the LED into the Anode. This is where we connect the positive battery terminal.
Real physical LEDs don’t have bent leads. The Anode lead on an actual LED is longer than the Cathode.
An LED is a diode and diodes allow the flow of current in only one direction. This direction is from the Anode to the Cathode.
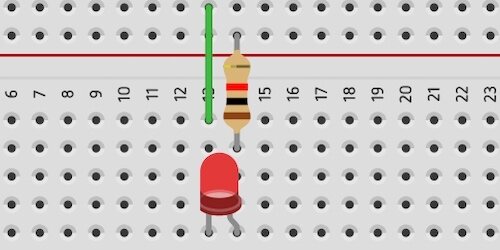
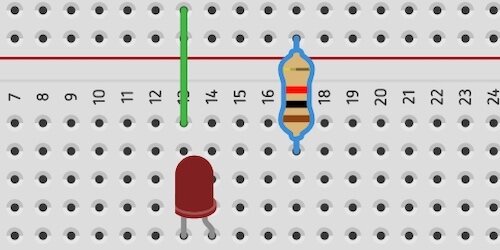
Place the resistor so it lines up with the row that has the Anode on the LED. The other end of the resistor will connect to the positive connector. Current will flow from the positive clips into the resistor. The flow of current is reduced in the resistor and the reduced current flows out the other end. It goes into the clip in the row and into the Anode end of the LED. The current will flow through the LED and exit the LED through the Cathode.
The image below uses arrows to demonstrate the flow of current.
Jumper Wires
To complete the circuit we need to connect the Cathode end of the resistor to the negative side of our breadboard. To do that we need a jumper wire. A jumper wire is used to bridge connections and gaps in our project. Move your mouse pointer over the row where the Cathode of the LED rests. The hole where our pointer is resting is highlighted with a red square. The other holes are highlighted with green circles.
Click once on the hole in the row with the Cathode and drag the mouse pointer toward the negative terminal rail. A green line follows our mouse pointer. Click once on the negative rail to anchor the other end of the lead wire. Don’t click again anywhere because this will cause another lead wire to be created. Press the ESC key on our keyboard to cancel if this happens.
We have all the elements in place for our basic LED circuit. We need a battery to supply the current.
The battery
Go to the Components panel, find a battery and place it next to the breadboard. There are three battery options available. Most students chose either the 9-volt battery or the Double-A battery. I recommend using the 9-volt battery.
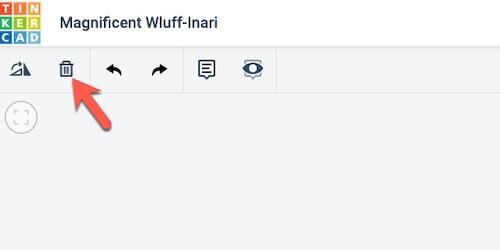
It’s easy to remove components from the work area. Click once on the component and press the delete key on your keyboard. You can also click the trash can icon in the button bar.
Attach a jumper wire from the negative rail on the breadboard to the negative end of the battery terminal.
Repeat the process with the positive end of the battery terminal.
Start the simulator
The circuit is complete. To light the LED we need to start the simulation. Click the Start Simulation button.
The LED will glow in our simulated circuit. Stop the simulation by clicking the Start Simulation button again.
What happens without the resistor?
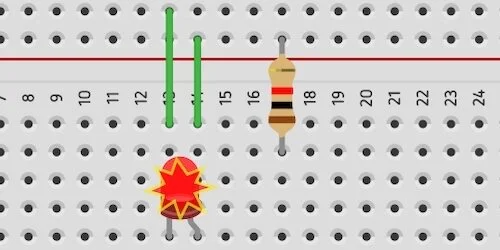
One of the benefits of working with the simulation is that we can make mistakes. Mistakes provide learning opportunities. We used a resistor to limit the flow of current into the LED. Without the resistor, the LED would burn out and possibly blow. I have seen actual LEDs give off smoke from too much current. Click and drag the resistor to the right. Place it a few rows down.
Add a jumper wire from the row with the Anode to the positive rail.
Start the simulation and observe what happens to the LED. The explosion symbol over the LED means that we sent too much current to the LED. A real LED will not work anymore if this happens. Stop the simulation. We’ll add a button so we can use it to turn the LED ON or OFF. That will appear in the next article. In the meantime see if you can attach a button to this circuit on your own.
Google Sheets Bar charts with multiple groups
Bar graphs are great when working with multiple groups of data. They are helpful when looking for patterns. Groups of data provide opportunities to look at data from different perspectives.
Google Sheets bar charts
Bar graphs are great when working with multiple groups of data. They are helpful when looking for patterns. Groups of data provide opportunities to look at data from different perspectives.
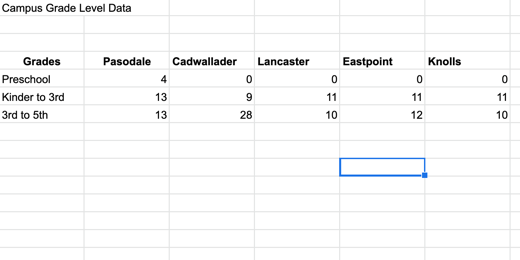
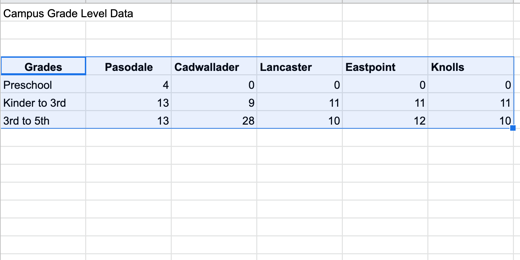
The data for this chart is shared with you here. Click this link to get a copy and follow along. The second tab in the sample worksheet includes data from multiple campuses.
Select the headings and data then click the Insert chart button.
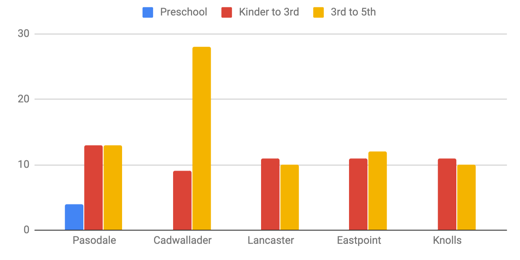
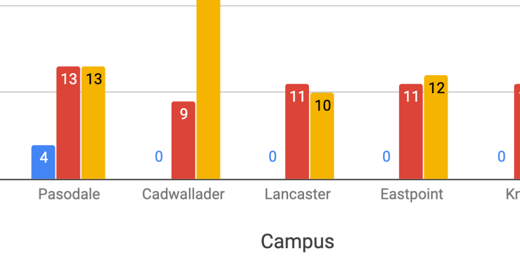
This bar chart includes more information. This chart includes a legend. The legend in this chart runs across the top. The data in the chart is grouped by campus. The bars for the data appear in the order that came from the table.
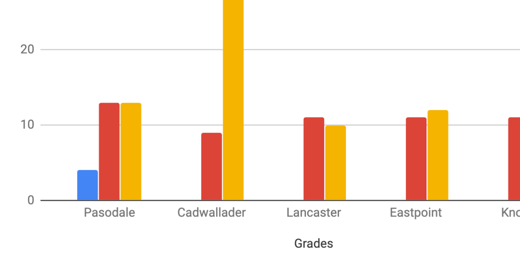
Google tried to help format the titles but they need some work. The horizontal title is missing and we need to change the title from Grades to something else. Change the title from Grades to Campus. Go to the Chart editor panel and change the font size to 16 points.
Click on the axis and titles selector. Choose the Vertical Axis title.
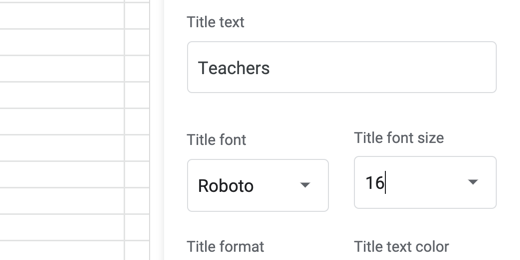
The vertical axis title is empty. Click once in the title field and type Teachers.
Change the font size to 16 points.
Change the title to “Teachers by Campus” and change the font size to 16 points. Change the text alignment to center align.
Showing the values on each bar would be helpful. Go to the Series section.
Scroll down a little and place a checkmark in the Data labels option.
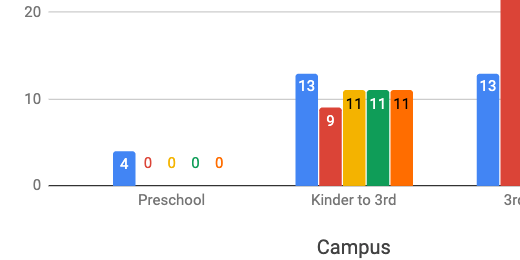
The data labels work well with all the values except Preschool. Only one campus has preschool teachers. It throws off the values for the other campuses.
We can format each data series. Click on the series selector.
Select the Preschool series.
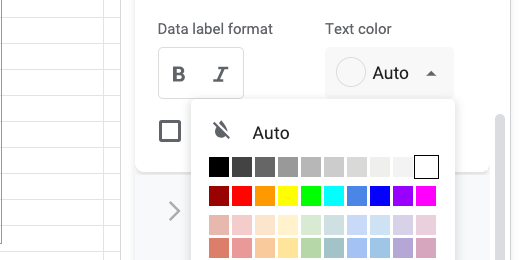
Go to the text color option. Change the value from Auto to white.
Changing the font color to white forces the color to change across all campuses. The value of zero is still there but we can’t see it because it matches the background color.
Data can be viewed from different perspectives. The data in our current graph is displaying values for each campus. We can also modify the view so we are looking at the values for each grade level. Switch to the Setup section in the Chart editor.
Scroll down and remove the checkmark from switch rows or columns.
The values are now grouped by grade levels. Switching the data grouping changed the formatting. Switching between data groupings causes this issue. The better option is to create two separate charts of the same data. Place a checkmark back on the switch rows or columns box.
Click once on the chart and click the actions menu. Select Copy chart. The chart is placed in the computer’s memory. Click Edit in the menu and select Paste.
The copy is pasted above the original. Click once on the pasted copy and go to the setup section. Change the switch row or columns box.
This takes us back to the version that needs formatting.
There are some bars without values. Let’s take care of them first. Go to the series section in the customize panel.
Place a checkmark in the Data labels box.
We need to fix the values in Preschool. We can fix this in one of two ways. Let’s take a look at the easiest way first.
Click the Text color selector and choose white.
This works well when the bars are bright colors and the background is white. There is another option that allows us to target our customization. Place the text color back to Auto.
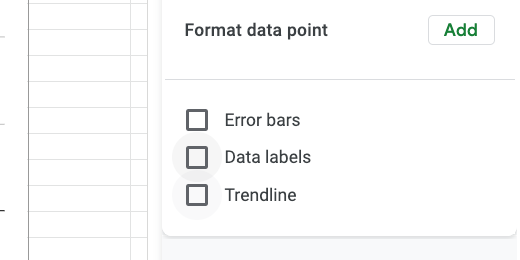
Find the Format data point option and click the Add button.
A data point selector dialogue opens.
Select a campus and the preschool that has a zero value. Click the OK button. Select white from the data color option.
Click the Add button again. Choose the next campus that has zero for the Preschool value. Change the data point color to white.
This option includes several steps but it does offer the flexibility to provide greater customization of text colors. Change the title of the slide to Teachers by Grade Level.
Bar Graphs in Google Sheets
Bar graphs are used to compare groups of information. Bar graphs compare groups of data at one point in time or across time. In this lesson, we will create a basic bar chart using Google Sheets.
Bar Graphs
Bar graphs are used to compare groups of information. Bar graphs compare groups of data at one point in time or across time. In this lesson we will create a basic bar chart using Google Sheets.
The dat for our graph compares the number of teachers in each grade level per campus. This graph will be a snapshot in a survey. It will be used for comparison with future surveys.
The data for this chart is shared with you here. Click this link to get a copy and follow along. You can skip over the next few instructions if you are using the link to the copied data.
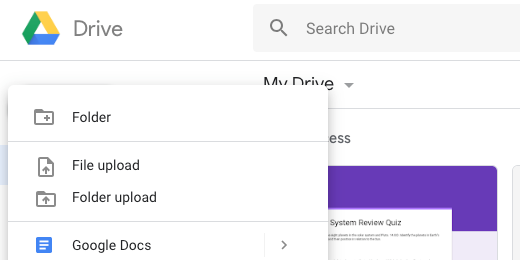
Create a new Google Sheet. There are a couple of ways to do this. Click the Apps launcher and select Sheets. Another way is to open Google drive at https://drive.google.com and click the New button. Select Google Sheets from the list of applications.
There are are a couple more ways. Go to the Sheets portal. The portal is at https://sheets.google.com. Click the create blank sheet button. One more way is to type https://sheets.google.com/create in the address bar.
If you are using the link to the example data then you will be presented with a copy option. Click Make a copy to save a copy to your Google Drive account.
Our graph doesn’t have much in the way of data. The point here is to understand the fundamentals and then apply them to other data later.
To create a chart we need to select data for the chart. The selection should include headings. The headings for our data include Grades and Teachers. Click and drag to select the eight cells.
There are a couple of ways to access the chart tools. We can click Insert in the menu and select Chart. I prefer to use the chart tool button in the button bar.
Google Sheets Charts will try to guess the type of graph you want to create with the data. The data we selected has one column of numbers. One column of numbers usually represent a circle graph. This is why we have a circle graph representing our data.
A circle graph is not the same as a bar graph. Circle graphs are used to represent the values from one group as a whole. Circle graphs are not typically used for multiple groups.
The Chart Editor panel opens on the right side of the sheet. The chart type selected is shown as a Pie chart. Click the Chart type selector.
Google Sheets will take a second look at your data and recommend a bar chart. Click the column chart option.
The graph is a better representation of our data. The bar graph is very nice. Google Sheets has done a lot of work for us. It has created a colorful graph with a title and labels. We’ll take it from here and put our own spin on the graph.
Click once on the chart. Hash lines appear in the title area. They also appear in the axis sections. These hash lines mean we can edit the information.
I will use the words chart and graph to represent the same concept. Some prefer to use the term chart. Others prefer the term graph. I hope this isn’t confusing.
Click the chart title. The hash lines will disappear and the title will be highlighted. Change the title to read Teachers per Grade Level.
The panel on the right changes based on what we have selected. The available options are displayed to help format the title text.
All the options are selected for us. Change any of them by clicking the selector.
Click the Title format alignment option and choose Center Align.
Click the Bold button.
There is a title to the left of the chart and below the chart. These are referred to as the x and y-axis labels. Click Teachers on the y-axis.
Google refers to the x and y-axis as vertical and horizontal. I use the terms x-axis and y-axis in class to reinforce math concepts.
The formatting panel updates so we have the tools needed to format the title.
Click on the Title font size selector. Change the font size to 18 points. Fonts are measured in points.
Click the color selector and choose dark green 1.
Repeat the process for the title at the bottom.
Click once on the bar graph itself. Resize handles should appear around the graph.
Click on the bar for Preschool. It will turn a darker shade when selected.
Change the bar color using the color picker. I chose a dark purple color for mine. Choose the color you prefer.
All the bar colors change to match. All the bar colors are the same because they are part of the same group.
In the same series panel, we have an option to display the data labels. Place a checkmark on this option.
The values for each bar appear near the top of each.
Change the font size to 16 points and change the font decoration to bold.
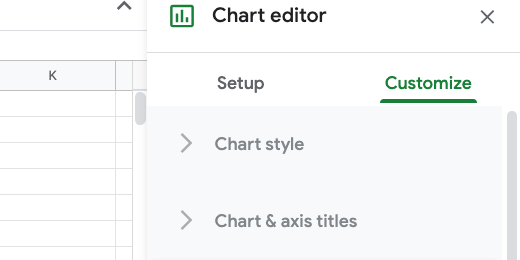
Scroll to the top of the chart editor and select Chart style.
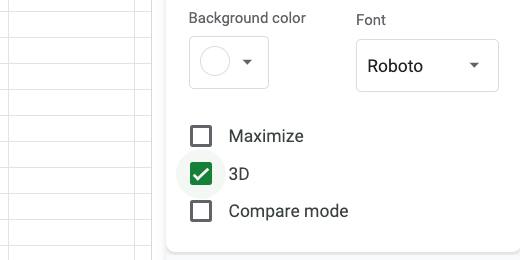
Place a checkmark in the 3D option. This gives our chart a nice 3D look.
Those are the fundamentals.
Splitting Cell Contents in Excel
The online version of Microsoft Excel has some limitations, but with some basic functions, we can perform some routine tasks. In this lesson, we will pull out keywords from cell contents using a function called LEFT.
Splitting cell contents with functions
The online version of Microsoft Excel has some limitations, but with some basic functions, we can perform some routine tasks. In this lesson, we will pull out keywords from cell contents using a function called LEFT.
In a previous lesson, we collected data with Microsoft Forms. The form surveyed students for their interest in summer programs.
We exported this data to an Excel spreadsheet so we could create our charts. Some of the data was easy to chart. The data that contains our preferred activities are combined into one cell. This makes it a little difficult to create a chart.
We need to separate the different activities that are grouped. We need to know the number of first-choice options. To count the number of separate first-choice selections we need to separate it from the rest of the data.
The online version of Excel has a limited set of tools. To do what we need online we need to use built-in functions. These functions are part of the full version of Excel. They are conveniently placed into a menu option for us. The online version doesn’t have this menu function so we need to do things manually.
Okay, why go through all of this? Why not just use the full version of Excel to do what we need? Great question. Not everyone, students, can afford to purchase Excel. The online version is free. If we have to use the online version then we need to know how to take advantage of the available tools.
In this lesson, we will separate the information we need. We will use a count function to count the number of first choice activities. In between, we will learn a few more functions. This information will help us to create our chart.
LEFT Function
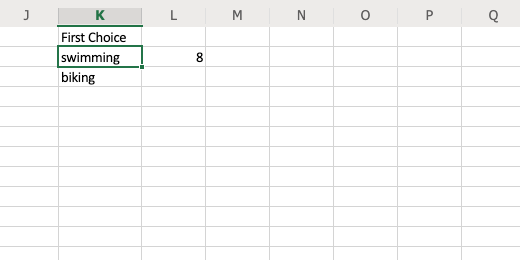
To separate the text in the column we need to learn a couple of functions. The first function finds content in the cell and places it into another cell. Skip a column after column I and go to column K. Type First Choice into the first cell. Press the Return key to go to the cell below.
Type the equal sign. The equal sign informs the cell we are going to use a formula or a function. Type the word LEFT. Left is a function. Type the word in uppercase letters. There is nothing special about using uppercase letters. But, It does help identify the function. Excel provides basic information about the function. This function returns a specified number of characters from the start of a text string. A text string is any text.
Type an open parenthesis. The parameters of our function are placed with parenthesis. Parameters tell the function what the text is and what we want to do with the text. The parameters required are provided as help text by Excel. We need to include the text and the number of characters.
The text we want to extract is in column H. We want to extract the text from the first cell under the heading in column H. The text is in cell H2. This means that the contents are in column H and row 2. Type H2 followed by a comma. Using the cell coordinates H2 is called cell referencing. Cell referencing points to the contents of a cell.
We need to provide the number of characters to pull out of the text. The word ‘swimming’ has eight characters. Type the number 8 followed by the closing parenthesis. Press the Return key.
The word swimming appears in the cell. This word is being pulled from the contents in cell H2.
Go down to the cell below and type the function to return the contents from cell H3. Here is the function, =LEFT(H3,6). The word biking is pulled from the text. This is great but we need to count the number of letters in each word we want to extract every time. We need a way for Excel to do this work for us. That brings up the next function we are going to use.
Search function
Each word in our cell is separated from the next with a semicolon. We are going to use this marker to help identify the word we want to extract. We are going to instruct Excel to find the semicolon and pull all the text before it. Let’s see how this works. Click on the cell next to the word swimming, cell L2. Type the equal sign and the word SEARCH. The search function looks for characters in the text.
Type an open parenthesis to provide the parameters for the function. We need to provide the text or characters to find, and where to search.
Let’s see how this works. Type a character from the word we need. Type the letter g. Place the letter within quotation marks. *Quotation marks are needed anytime we need to refer to a piece of text. Text like letters and numbers are different in Excel. *Type a comma after the closing quotation mark.
The text is in cell H2. Tye H2 after the comma and add closing parenthesis. This function will search for the first occurrence of the letter ‘g’ in the cell. It will return to us the position of the letter. Press the Return key.
The number eight tells us that the letter ‘g’ is the eighth letter in the text. This matches with what we know. This is the information we provided in the previous function. All the words we used for the activities end with the letter ‘g’. We can simply look for the letter and use it in the function. What if all our words didn’t end with the letter ‘g’? The character that is consistent in all the texts is the semicolon.
Updating our function
Let’s combine both functions to deliver the results we need. Click on the word swimming in cell K2. We need to update the function for this cell. The function is hidden by the results of our function. To edit a function it is often better to edit it in the formula bar.
The formula bar is located below the ribbon. We see the function in cell K2.
Erase the number 8 from the function and type the word SEARCH.
Type opening parenthesis. Type the semicolon character within quotation marks. Type a comma after the closing quotation mark. Type the cell where we want to search for the semicolon, cell H2. Type a closing parenthesis after the cell reference.
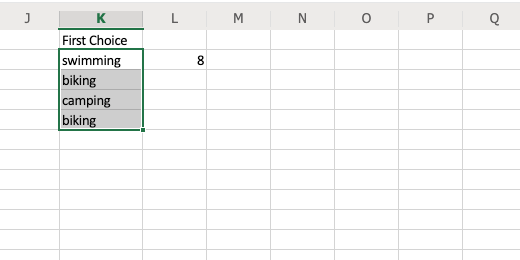
Looking at the contents of cell K2 we see that the word “swimming;” appears in the cell. The contents include the semicolon. That doesn’t look right. We need to get rid of the semicolon.
Return to the formula bar. The search function returns the location number. The location number for the semicolon is 9. We know this because the location for the letter ‘g’ is eight. We need to subtract the location of the semicolon. Tye a “-1” between the closing parenthesis. Don’t include the quotation marks. We are taking away one from the total count.
The word in cell K2 appears without the semicolon.
Copy cell contents
We need to copy this formula down to the other cells in the column.
Look at the highlight border of the cell we have selected. In the bottom right corner is a small square. Move your mouse arrow to the square. Stop when it changes to a plus sign.
Click and drag the square down to cell K5.
The formula is copied over the formula in cell K3. It is also copied to cells K4 and K5. Click the square and copy the formula to the rest of the cells in the column. Stop when you reach the last row of responses.
Counting responses
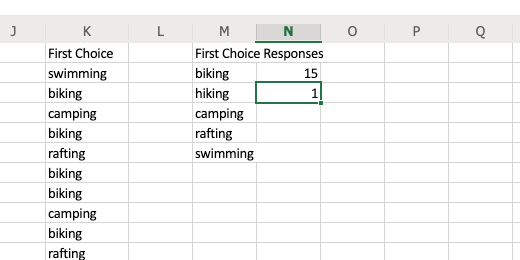
We need to count and group the responses for each choice. Go to cell M1 and type the heading First Choice Responses. Type each response option in a separate cell below the heading. *Click on cell L2 and press the delete key to erase the test function we used.*
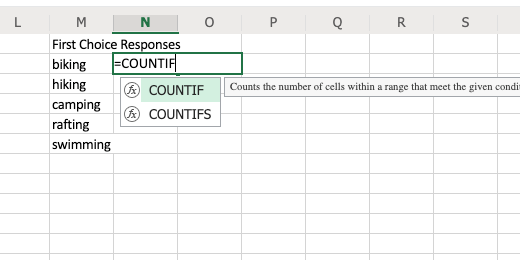
Click cell N2. This is the cell to the right of biking. Type an equal sign and type the function COUNTIF. This function counts the number of cells in a range that meet a criterion we provide. We are going to have the function look at the content in our first choice column and count the number of times the work biking appears in a cell.
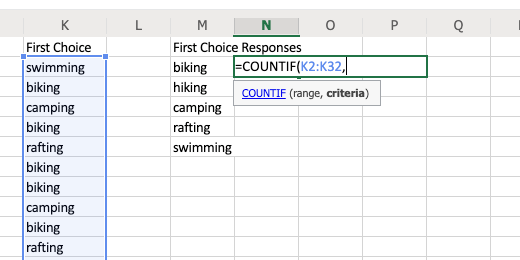
Type an open parenthesis. Type K2:K32 after the parenthesis. We specify a cell Range by typing the first cell in a Range followed by the last cell. The rows in column K from K2 to K32 are highlighted. Type a comma after the Range values.
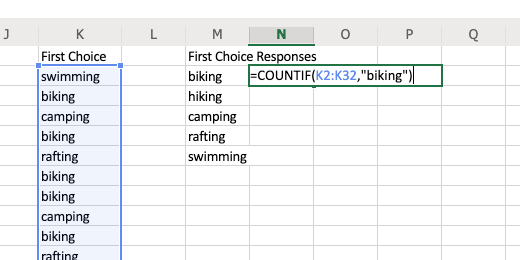
We need to provide what to search for in the selected range. We want to search for the word biking. Type the word biking within quotation marks. Type a closing parenthesis after the closing quotation mark. Press the Return key.
Biking is selected 15 times as the first choice of 31 responses.
Repeat the process for hiking. Go to cell O3 and use the COUNTIF function. Look for hiking. The formula looks like this, =COUNTIF(K2:k32,”hiking”).
Repeat the process for the other choices. Biking is popular for a first choice. It is followed by rafting and camping.
We have the information needed to create our graph. I recommend creating a circle chart.
Microsoft Form Responses with Excel
Information collected with Microsoft Forms is collected in a response page. The response page arranges the collected information into graphs. The graphs themselves are interactive. Exporting the data to Excel provides a way for us to generate our own graphs.
Form Responses
Information collected with Microsoft Forms is collected in a response page. The response page arranges the collected information into graphs. The graphs themselves are interactive. Exporting the data to Excel provides a way for us to generate our own graphs.
Microsoft Forms is a nice tool for collecting survey information. Once we collect the responses, they appear on the response page. The Response page is available when editing the form. The responses are nicely organized for us with graphs that represent the answers for each question.
I created a form to survey students on summer activities. This is from a previous lesson, Microsoft Forms An introduction. The form has received 31 responses.
Click the Responses tab. Responses to each question are graphed. The responses for the student’s age are placed into a circle chart.
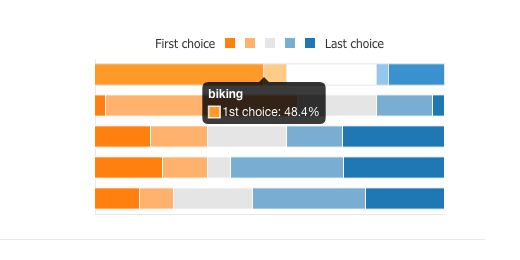
The responses for the activity choices are placed into a horizontal bar chart.
The chart is a stacked bar chart. Rolling our mouse arrow over one of the charts displays information about the data. The example in the image below shows that 48.4 percent of the respondents selected biking as their first choice.
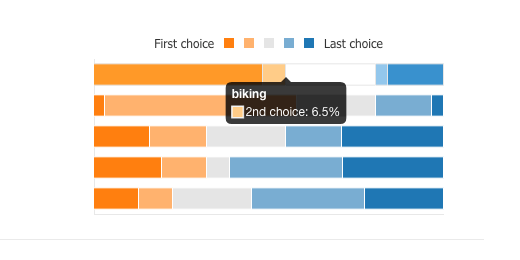
The next section in the graph shows that 6.5 percent of the respondents selected biking as their second choice.
There is an Excel link at the top of the Responses section. This gathers all the form results and exports it to an Excel spreadsheet. The data in the spreadsheet is downloaded to your computer.
I want to upload this file to my online OneDrive account and create charts using the online version of Excel. In this way, we can access the file anywhere and on any device.
Excel online
Click the apps launcher and select the Excel tile.
The option to upload a workbook is found on the top right side of the Excel portal. I’ll click the Upload a Workbook link. The workbook is titled Summer Activities Survey.
The spreadsheet has several columns of information. The columns that interest us are the last three. These columns include the child’s age, favorite activities, and if they need transportation. This is the data we can use to create charts.
The data that is easiest to chart is the student ages and if students need transportation. The choices for activity are not easy to chart. This data needs to be separated before it can be graphed.
Microsoft Forms: An Introduction
Create polls and surveys with Microsoft’s free form application. All you need is a free Microsoft account. Create and share forms online. Nothing to install.
A Basic Form
Microsoft Forms is an application for creating polls or surveys. The form is created and shared online. You don’t need to purchase Microsoft Office 365 to use Forms.
Microsoft offers basic services for free with their Outlook email account. The services are all Cloud based with support for apps on mobile devices. The services include the three major applications. For the purposes of these lessons I will be using a free account. I want you to be able to follow along even if you don’t have a Microsoft Office 365 purchase.
I recommend using the Microsoft Edge browser on Windows devices. Use the Chrome browser on Mac computers. Apps are available for mobile devices but I will not be using them in these lessons.
Log into your Microsoft account. Logging in usually takes you to the Outlook email application. We will begin there. The apps and services are available from the apps launcher. The launcher is an icon made of nine tiny squares. The launcher is located in the upper left corner. The launcher is found here in all applications.
Click the launcher and select OneDrive. I like to start form OneDrive whenever possible.
Click the apps launcher in OneDrive. Look for the Forms tile and click on it.
The Forms landing page has two buttons and one sample form. There is a button to create a generic form and one to create a quiz form. Click the button to create a generic form.
There isn’t much on the form now. Click on the Untitled form name and change it to Summer Activities Survey. There is an option to provide a description. This is a good place to provide information about the goal of the survey. Provide a brief description. We want students to let us know which activities are their favorite.
Every survey begins with a question. Click the Add new button to create the first question. We need to collect the student’s name. Select the text response option.
Fill in the question to prompt them to enter their name. We need to make sure the student’s fill in this information. We need to make the answer required. Enable the required option for the question.
We need a question to get the student’s age. This will help schedule the children with others in the same age category. Create a new question. Select the option to request an answer from a set of choices.
Prompt the student for their age. Provide the possible answer choices. The choices range from 10 to 13. Enable the option to make the question required.
We want the student to list their favorite activities from most to least favorite. Create a new question. Click the three dots on the extreme right. This is the actions menu. Select the Ranking option. This generates a question with some interactivity for students.
We want students to list the activities by moving them up or down the list. They will move their favorite activity to the top of the list. Their least favorite will be moved to the bottom. We are giving them a choice of five activities. The activities are hiking, swimming, camping, biking, and rafting. Make sure the question is required.
Add one more question. Create a question with a select response. We want to know how many students need transportation services. The form anticipates that we are prompting for a yes or no response. It is offering suggestions to fill in the form for us. Click the Add all button. This includes the maybe option.
Previewing the form
That is all the information we need to gather with the form. Let’s see how the form works. Click the Preview button. It is in the button bar at the top right.
Go to the question with the activity choices. Click and drag the activity choices up or down to see how they work.
Fill in the information. Click the Submit button. A thank you message appears when the form is submitted. Click the back arrow to return to edit mode.
Form responses
Microsoft Forms collects all the responses and creates a variety of graphics. This helps us visualize the data. Click the Responses tab.
This gives students an idea of what the graphs will look like. They will be more informative once students begin to fill out the form. The charts update as forms are submitted.
We took the survey and our response is part of the data. We should clear our response from the form. Click the actions menu and select Delete all responses.
Sharing the form
Once the form is set we need to make it available. Click the Send button.
A link to the form is created. Click the copy button. This copies the link into the computer’s memory. Once in memory we can paste the link anywhere. There are other options for sharing the form. Click the button to the right of the link button. This is the QR code generator.
An image is generated. This image represents the link to the form. Devices like smartphones with cameras use this image to capture the link. The image represents symbols the device and software detects. This image is interpreted as the link to the form. This image is useful when your audience is going to use mobile devices to access the form. It avoids having to type out the link in the browser. Click the button to the right of the QR code button.
This button generates embed code. Embed code is used to place the form inside a web page. The link to the form is surrounded by code that instructs the web page to place the form in the page. The last icon sends the link out in an email.
The link is placed on my classroom site. I like to use all the link options. The embed code is useful for keeping the user on my classroom website. The link for the form works best with users using mobile devices like smart phones. I do this because the screens are too small on phones to accommodate the form and web page. I include the QR code on the page so users of mobile devices can easily access the form by scanning the code.
Take a look at the form here. The form is disabled so you will not be able to submit any responses.
Google Doc paragraph styles
Paragraph styles allow us to quickly and easily update all the text in our document. Paragraph styles are commonly used in publication software.
Formatting paragraphs
Paragraph styles allow us to quickly and easily update all the text in our document. Paragraph styles are commonly used in publication software.
Google Docs includes paragraph styles for titles, subtitles, headings, and regular paragraphs. We will focus on paragraphs styles for most of the article.
Create a new Google document. You don’t need to create any content for the document. We will be using Lorem Ipsum text. This text is used as place holder text. Place holder text is commonly used to create the layout of newspapers, magazines, and websites. It is used to determine the layout of the finished product. Written content is usually imported into a final product. The final text replaces the placeholder text.
There are places on the web that have Lorem Ipsum text available for designers. There are several Lorem Ipsum generators out there. One that I use regularly is https://loremipsum.io/. Go to this website. Click the Generate button. Generate five paragraphs of text. Click the Copy button.
Return to the Google document. The copied text is formatted with extra code. This code has extra formatting information we don’t want. We need to strip this code away. Click edit in the menu and select Paste without formatting. Removing the formatting assures that the formatting comes from the paragraph styles in our document.
Five lengthy paragraphs are inserted. I like to break up the paragraphs. Click somewhere in the middle of each paragraph and press the return key twice.
Pressing the return key twice is one way to create new paragraphs. It is not the best way. It is formatting from the old typewriter days. We don’t do this anymore. Let’s begin with formatting the paragraphs. Select the first paragraph.
Selecting text
You probably clicked and dragged your mouse from the beginning of the first sentence to the end of the last. Here is another way to do the same thing. Click three times anywhere in the paragraph. That selects all the contents of the paragraph without the need to click and drag. This is useful when using a laptop with a trackpad that might be hard to use.
Begin by changing the font. I like to use a font with different typeface options. A font is a family of typefaces. A typeface is like thin, bold, or italic. One font family I like to use is Montserrat. It offers a variety of typefaces. I think they are easier to read on screen.
Adding fonts
You might not have any of these font families installed. So let’s go and install one or two. The fonts are not installed on your computer or device. They are associated with your Google Document. Click the font selector and choose More fonts.
There are thousands of fonts available. You could spend hours just looking through them. Feel free to do so. We are interested in installing specific ones here.
Type Montserrat in the search box. Click on the font once when it appears in the list. A check mark appears next to the name and the font family is added to our account. That was easy. Click the OK button to return to the document.
The new font is selected and applied to the paragraph.
Click the font selector and hover over the triangle next to the font family name. The normal typeface is applied to the paragraph. This is exactly what we want.
Updating paragraph styles
The paragraph we selected has the typeface applied but it is not applied to the other paragraphs. Instead of selecting each paragraph and applying the font we will use the paragraph style to do the work for us. Make sure the paragraph is sill selected and click the paragraph styles selector.
Don’t click on a style because it will return the paragraph to the previous font, Ariel. If this happens go back and select the Montserrat normal typeface again.
Move your mouse over the triangle to the right of the normal text paragraph style. Select the option to update the normal text style to match our changes. The rest of the paragraphs in the document will update.
Earlier, we pressed the return key twice to create a new paragraph. It should be one Return only. Keep the paragraph selected. Click the line spacing selector. Choose Add space after paragraph.
Extra space will be added after our paragraph. This space is in addition to the space created from the extra return. Update our normal text paragraph style. Click the paragraph styles selector. Update the Normal text paragraph style.
All the paragraphs have the extra space added between the paragraphs. Click once between each paragraph and delete the extra Return.
Sphero's weight, mass, and density
Sphero is a physical object. It has a mass and it has weight. We will use mass to determine buoyancy. Yes, Sphero floats.
The Science
Sphero is a physical object. It has mass and it has weight. We will use mass to determine buoyancy. Yes, Sphero floats.
Mass is the amount of matter an object has. The mass of an object remains the same or constant.
The weight of an object is the affect of gravity on an object. The weight depends on the gravity. The gravity on Earth is constant for our purposes. Gravity is affected by altitude on Earth. There is a close connection between mass and weight but they are two separate things.
Gravity relies on the mass of the Earth. It also relies on the elevation of the object weighed. Objects on the surface of the earth feel a greater pull by gravity. Objects in orbit around the earth, like a satellite, don’t feel the pull of gravity as much. This is why objects in space are said to be weightless.
An astronaut on earth could weigh about 200 pounds. In space that same astronaut’s weight can’t be measured. This is because there is not gravity to push down on the weight scale.
This is what makes mass different from weight. The astronaut has not changed. His or her matter has remained the same. Everything is made of matter. Some matter is light and some is heavy. The measurement of this amount of matter is called mass. The more matter something has the greater it’s mass.
Sphero’s Weight
There are a variety of ways to weigh Sphero. The easiest is to use a kitchen scale. Sphero comes with a base for charging. We will use this base to prevent it from rolling off the scale. Get yourself a kitchen scale. Turn on the kitchen scale and place the charging base on the scale. The scale will read the weight of the charging base.
We need to subtract this weight. There are a couple of ways to do this. The most obvious way is to take the base weight and subtract it from the total weight after adding the Sphero. Another way to eliminate the base weight is to use the Tare option on the scale. Most modern kitchen scales have this option. There is usually a button on the scale that reads Tare.
To use the Tare, press the Tare button on the scale. The scale will eliminate the base’s weight and display a zero. Just like the base was not on the scale.
Place Sphero on the base and read the weight on the scale. In Standard measurement, Sphero weighs approximately 6.35 ounces. In the Metric System, Sphero weighs 180 grams.
Sphero’s mass is 180 grams. The scale compensates for Earth’s gravity. Earth has a constant gravitational pull of 9.807 meters per second squared. The scale eliminates this force from our value.
A Balance scale
Let’s use a balance scale to check our value. Balance scales are used to measure mass. We use a balance scale to measure the mass of one object with the mass of another. We place one object on one side of the scale. On the other side we place objects that have a known mass. The objects are usually metal weights.
The mass of the weights is marked on each. We place enough of these weights until the scale is balanced. The total mass placed on the scale is used as a measure of the mass on the other side.
The the value of the weights placed on the other side of the balance total 180 grams. This agrees with the value from the kitchen scale.
This is part of the scientific process. We take measurements and then we need to verify those measurements. If the measurements are different then we need to understand why.
Buoyancy and Density
We know that Sphero floats. It is water tight. Make sure there are not cracks on your Sphero. These lessons cover buoyancy, density, and water displacement.The buoyancy of something depends on its density. Water has a density of 1. Objects that have a density greater than one will sink. Objects that have a density less than one will float. We will calculate the density of Sphero in a moment.
First, we need to know how we arrived at the density of water. Place a beaker on the kitchen scale. Press the Tare button to set the scale to zero. Pour 250 mL of water into the beaker. Read the measurement on the scale. Make sure the measurement units are in grams. The measurement is the same as the amount of milliliters we placed in the beaker.
To determine the density of water we divide the mass by the volume. The volume in milliliters is 250. The mass in grams is 250. The answer is one. The density of water is one.
Sphero’s Density
Sphero is enclosed in a plastic sphere. We will place Sphero into water and use it to learn about buoyancy and density. Buoyancy is the capacity for something to float. The density of an object has much to do with its ability to float.
We need a container with water. The container needs to have a way for us to measure the amount of water. A beaker is a good container to use if you have one large enough. I find that a two-cup kitchen measuring cup works well if a beaker isn't available. These measuring cups are available at any discount store for a few dollars. They have a nice handle to hold onto.
Fill the container to the one-cup measurement. Add some food coloring to help you see the water level if necessary.
Insert Sphero into the measuring cup. Sphero displaces the water in the measuring cup. Sphero forces the water up and around the measuring cup. The water level rises to one-and-three-quarter cups. Sphero displaces three-quarters of a cup of water.
Sphero doesn't completely float and it doesn't completely sink either. This is due to Sphero’s density.
To find the density of an object we need to divide the mass of the object by the volume. This is where all the math we did earlier comes together.
Sphero has a mass of 180 grams. It has a volume of 180 cubic centimeters. Sphero’s density is One! This is the same density as that of water. This explains why most of Sphero is submerged in water. Much like an iceberg.
All the science we just did would not be possible without the math we used in the previous lessons. This is that math science connection we are always wanting to make with students.
Sphero's volume and surface area
Sphero is a sphere with volume and surface area. To calculate this information we need one piece of information. We need to know the radius.
Basic math to understand Sphero’s geometry
Sphero is a sphere with volume and surface area. To calculate these values, we need one piece of information. We need to know the radius.
The radius is the distance from the center of the sphere to any point on the surface. We know that a line drawn from one point on the surface through the center and to another point is the diameter. The radius is half the length of a diameter. This information is similar to that of a circle.
There isn't a way for us to measure the radius of our sphere. We would need to disassemble the robot. We can, however, measure around the sphere. There are two values that we can measure. Both of these values will help determine the information we need.
Let’s begin with the easiest. For this exercise we will need a length of string. The string should be at least twelve inches long. The string shouldn't be too thick.
Find the seam along Sphero’s surface. Place one end of the string on a point on the seam. Wrap the string around the seam until it meats up with the string’s starting point. Use a marker or pen. Mark where the string meats the starting point. This measurement isn’t very accurate but we will round our measurement later.
Use a ruler. Place the starting end of our string at the beginning of the ruler’s measurement. Lay the string along the ruler. Find where the point we marked the string lays on the ruler. This is the circumference.The circumference from the measurements of my Sphero resulted in approximately nine and a quarter inches, 9.25in. The equivalent measurement in centimeters is 23 cm. Most rulers have both units of measure.
To determine the radius we need to use the formula for the circumference of a circle. The formula multiplies the diameter by Pi. To solve for radius we need to reformat our formula. This step takes us into the use of algebra.
We want the diameter to be on one side of our equation. Let’s begin by writing down our values into the equation. Take the value of the measurement and write it down. Place an equal sign to the right and then the value of pi, 3.14. Place the multiplication symbol to the right of pi and D for diameter.
We need to move the value of pi to the left side of the equal sign. To do this we need to divide by pi. Place a divisor and the value of pi under the circumference. Place a divisor and the value of pi under pi.
When we divide a number by the same number the answer is always one. Pi divided by Pi is one. One times the diameter is the diameter. We don’t need to write the number one.
Dividing the circumference by pi gives us the diameter. The diameter in inches is approximately 2.945 inches. The diameter in centimeters is approximately 7.324 cm. The value we get here is an approximation. The diameter is twice the radius. To get the radius we divide the diameter by two. The radius in inches is 1.473 in. The radius in centimeters is 3.662 cm.
Rounding the values for radius would seam to be reasonable but we will stay with this to review operations with decimal values. With the radius of our sphere we have the information needed to solve for surface area and volume.
The surface area of a sphere is calculated by squaring the radius. The product is multiplied by pi. This product is then multiplied by four. We’ll use my measurement in inches first. The radius from my diameter of 2.945, is 1.473. This gives us an approximate surface area of 27.247. We must state the units of measure in the answer. The complete answer is 27.247 square inches.
The volume is calculated by cubing the radius. This value is multiplied by pi. That value is then multiplied by 4 and divided by 3. The volume is approximately 13.387 cubic inches.
Now we will calculate the surface area and volume using our measurement in centimeters. The radius from our diameter, 7.324 is approximately 3.662. The volume is approximately 205.704 cubic centimeters. The surface area is approximately 168.518 square centimeters.
Recalculate with rounding
The answers from our measurement of Sphero’s circumference are approximations. The string and ruler are not the most accurate tools. I used a Vernier caliper to measure Sphero’s diameter. A Vernier caliper is a ruler with a measurement scale. It is used to take precise measurements. With the caliper I measured Sphero’s diameter at 7 centimeters. Use this updated measurement to recalculate Sphero’s volume and surface area.
Here are my answers so you can compare. Sphero’s volume is 179.594 cubic centimeters. Round this to 180 cubic centimeters. The surface area is 153.938 square centimeters. Round the value to 154 square centimeters. I will use these values from this point forward.
The information we gathered in these math activities will be used in our science activities. Remember the values for volume because they will come up again later.
Blog banner image inspired by Freepik
Hiding Google Team Drives
Team Drives are useful for projects. Once the project is done there is no need to access the Team Drive but, we don’t want to get rid of it. Archive it and recall it later.
Hiding drives
Team Drives are useful for projects. Once the project is done there is no need to access the Team Drive but, we don’t want to get rid of it. Archive it and recall it later.
There is often very important information that can be of use lather. Some projects recur and it is useful to hold on to the Team Drive for future projects.
Our department creates lots of Team Drives for different projects. We often revisit projects the following year but don’t need to see the drive during the rest of the months. Hidden Team Drives are not visible in the main Team Drive section. They are not deleted but placed in a section for hidden drives. This is similar to arching a drive or archiving something like a Google Classroom. Click the team menu and hide Team Drive.
To unhide a Team Drive we need to go to the Hidden Team Drives section.
Select Team Drive to unhide.
Click the actions button in the menu bar and select unhide Team Drive. Return to Team Drives to view the active Team Drive. All content in hidden Team Drives is still accessible by any member. Shared links to documents are available too.
I use Team Drives to develop spreadsheet applications and Google sites. I hide these drives to keep things clutter-free. Access to the content remains available to campuses. Note that hiding a Team Drive on my account does not hide it from other accounts that have access.
Customize Google Team Drives
A Team Drive theme can help differentiate and identify team drives. Each Team Drive is given an image to represent the Team.
Drive themes
A Team Drive theme can help differentiate and identify team drives. Each Team Drive is given an image to represent the Team.
In previous articles I spent time demonstrating how to use Google Team Drive. One feature I left out is how to customize the look of the Team Drive.
Go to the Team Drive menu and move your mouse over the Change theme option. Select the option to Pick from the gallery.
There are several generic images available for use to use as the Team’s theme. Click the Cancel button.
Go back to the Change Theme option and select Create a custom theme.
Our Google Drive content is opened and displayed. We can use any image from our Drive to represent the Team’s theme. Choose an image for your theme or stay with the default.
Searching Google Team Drive
Searching Team Drive contents is one of the more useful features. The search option is available in the Team Drive menu.
Searching
Searching Team Drive contents is one of the more useful features. The search option is available in the Team Drive menu.
After selecting the search option, use the regular search box to search for content within the drive. Close the search filter by clicking the ‘x’. Closing the drive filter returns us to My Drive instead of the Team Drive. Hopefully, Google will fix that soon.
Google Team Drive Email
Communicating with team members on a project is an ongoing process. Google Team Drive provides a way to send communications to specific members in a team.
Email Members
Communicating with team members of a project is an ongoing process. Google Team Drive provides a way to send communications to specific members in a team.
Open a Team Drive. Team Drives are not available with personal accounts. Click the triangle for the team drive. The email option makes it easy to email everyone in the team with important information and notifications.
Emailing members has some important options to note. We don’t always need to email everyone in the team. There are times when we need to notify content managers or contributors only. There is an option to email everyone or deselect those that do not need to receive an email. Very useful if I am a manager and don’t need to receive messages meant for contributors.
Removing the selection from each category removes the accounts associated with that permission level. Those accounts won’t receive an email. We won't send a message now. Click the Cancel button.
This is an effective way of communicating with specific team members. It is helpful when there are lots of members in a team.
Google Team Drive Settings
Google Team Drive offers a variety of tools for working with Teams. There are settings we can adjust to help improve working in Team Drive.
Drive settings
Google Team Drive offers a variety of tools for working with Teams. There are settings we can adjust to help improve working in Team Drive.
We have the option of controlling how content is shared within the organization. We have control over how team members have access to content. Sharing content by team members is configurable in settings. In this article we will take a look at each of these settings.
Click the disclosure triangle again and go to Team Drive settings.
In Team Drive settings we customize the sharing options. Click on Edit for sharing outside the organization.
Members outside the organization can be given access to content in the Team Drive. This is on by default. To increase security with important or sensitive content we should only allow access to members of the organization. This means anyone in the team can share content with anyone outside the team as long as they are in the organization. Click the Cancel button.
Click the Edit button for sharing with non-members. Accounts apart from the team member accounts can be given access to content. For increased security, we can change the option so only members can access content in the drive. Members of the team cannot give access to anyone outside the team. They can’t share files with anyone outside the team either. Click the Cancel button.
Click Edit for Download, copy and print. Anyone in the team can download, copy, and print content from Team Drive. We can restrict this access to commenters and viewers. Other members of the team still have access to download, copy, and print content. Click cancel and Done.
