Microsoft Form Responses with Excel

Form Responses
Information collected with Microsoft Forms is collected in a response page. The response page arranges the collected information into graphs. The graphs themselves are interactive. Exporting the data to Excel provides a way for us to generate our own graphs.
Microsoft Forms is a nice tool for collecting survey information. Once we collect the responses, they appear on the response page. The Response page is available when editing the form. The responses are nicely organized for us with graphs that represent the answers for each question.
I created a form to survey students on summer activities. This is from a previous lesson, Microsoft Forms An introduction. The form has received 31 responses.

summer survey of activities
Click the Responses tab. Responses to each question are graphed. The responses for the student’s age are placed into a circle chart.

Form created charts
The responses for the activity choices are placed into a horizontal bar chart.

Form horizontal bar charts
The chart is a stacked bar chart. Rolling our mouse arrow over one of the charts displays information about the data. The example in the image below shows that 48.4 percent of the respondents selected biking as their first choice.
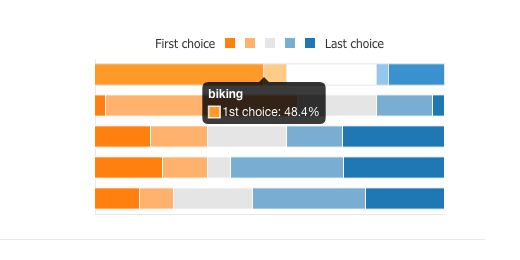
Interactive bar chart
The next section in the graph shows that 6.5 percent of the respondents selected biking as their second choice.
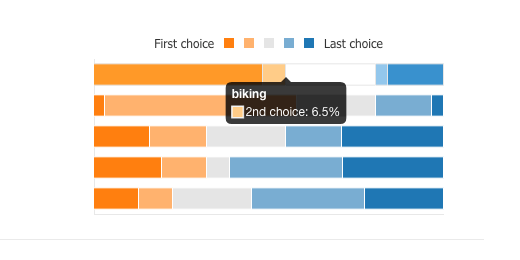
Interactive bar chart example
There is an Excel link at the top of the Responses section. This gathers all the form results and exports it to an Excel spreadsheet. The data in the spreadsheet is downloaded to your computer.

Open in Excel link
I want to upload this file to my online OneDrive account and create charts using the online version of Excel. In this way, we can access the file anywhere and on any device.
Excel online
Click the apps launcher and select the Excel tile.

Excel Tile from Apps Launcher
The option to upload a workbook is found on the top right side of the Excel portal. I’ll click the Upload a Workbook link. The workbook is titled Summer Activities Survey.

Upload a workbook
The spreadsheet has several columns of information. The columns that interest us are the last three. These columns include the child’s age, favorite activities, and if they need transportation. This is the data we can use to create charts.
The data that is easiest to chart is the student ages and if students need transportation. The choices for activity are not easy to chart. This data needs to be separated before it can be graphed.

Form spreadsheet responses