Publishing Google Charts with Google Drawings

Introduction
Welcome to the third lesson in a four-part lesson for publishing Google Charts. This lesson focuses on the publication of Google Charts with Google Drawings.
In a previous lesson, we learned how to publish charts on their own. We published a Google Sheet to simulate a dashboard. We used a Google Doc to publish the chart and include detailed information.
Google Drawings has features that make publishing charts easy. Google Drawings allows us to be creative. Charts are often part of infographics. We are using a basic infographic to publish the chart in this lesson.
Use the link below to see a preview of the final product.
Use the links below to get a copy of the Chart and Drawing working documents.
The Chart
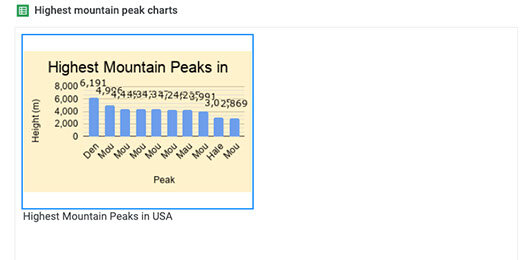
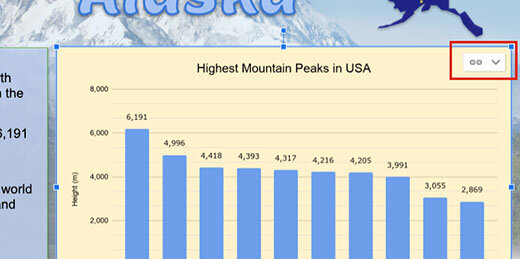
Take a look at the chart on the Google Sheet. The chart displays the top ten highest mountain peaks in the United States. The data for the chart comes from a Wikipedia article. The link to the articles is available in the Sheet. The data is in the Peaks sheet.
The Table uses a Query to filter for prominent peaks in the United States. The Google Sheet with the chart doesn’t need to be open. You can close it after reviewing the information.

The Drawing
The template has a background image of the Denali mountain. It has a title and text box with basic information about Denali. There is a place for the chart next to the text box.

Go to the menu and click Insert. Go to the Chart option and select From Sheets.

Look for the spreadsheet titled Highest Mountain Peaks. The preview shows the table and chart in the first sheet. Select the spreadsheet.

The import box displays the only chart in our spreadsheet.
The chart is linked to the spreadsheet; this is important. Select the chart and click Import.

Resize the chart and place it next to the information box. The chart shows a link to the spreadsheet. We will come back to this later.
Click the Share button.

Click the option that reads Change to anyone with the link.

Click the Copy link button.

Open a new tab and paste the link into the address bar. The link ends with the word edit and some other information.

Replace edit and anything that comes after, with the word preview. Press the Return key to render the page.

Our drawing is nicely published for the world to view.

The data in the published drawing is live. Leave the tab open and return to the Drawing tab. Click the Done button to close the link box.

Click once on the chart. Click the Link button and select Open source.

The information in the table for the chart is from a Query. Click on the Heading titled Peak. Look at the query in the Formula bar.

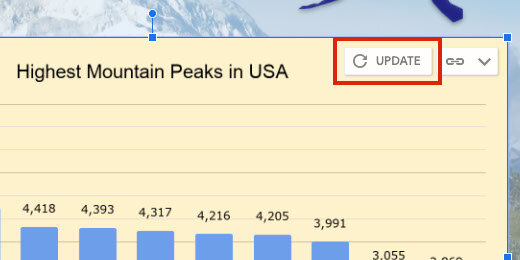
Go into the Formula bar and change the Limit parameter from 10 to 5. The Limit parameter limits the number of results returned in the query. Press the Return key to update the query.

The table and chart update

Return to the Drawings tab. An update button appears next to the Link menu. Click the Update button.
Go to the published drawing tab. Refresh the page to show the changes.

Google Drawings is very useful for creating elaborate documents. An infographic is one document format that works well with charts and drawings.
The publish option
There is a publishing option for Drawings. This is similar to publish options in Sheets, Docs, and Slides. There is one important difference. The publish option does not provide a web version of the drawing. Let's take a look.
Click File and select Publish to the web.

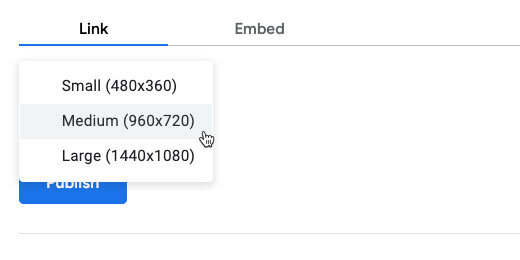
Publishing Google Drawings comes with an option to select the resolution of the published image. The medium resolution is recommended.
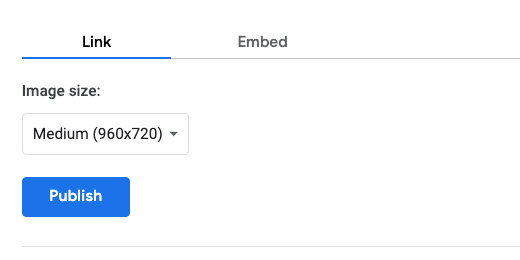
The other resolution options are small and large. Stick with medium and click the Publish button.
Confirm you want Google to publish the drawing.

A link is generated for the published document. Copy the link; create a new tab and paste the link.
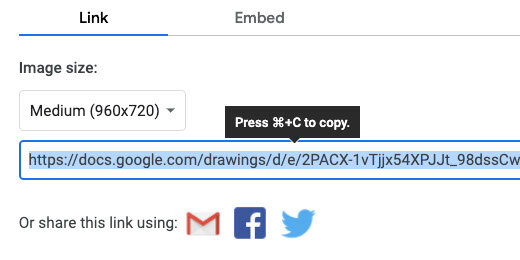
Press the Return key. You most likely won’t see the chart displayed on the page. The drawing is converted to a PNG image and downloaded to your computer.
This option doesn’t serve us here for what we want to do. It is useful for other purposes. It is a good way to distribute and share images. It is also a good way to embed images in other Google products.