Micro:bit temperature sensor data collection

Sensor data
The Micro:bit has a variety of sensors. They are an excellent way to collect data for science investigations. I like the temperature sensor. It provides immediate feedback for something that students can readily relate to. The temperature sensor is a good way to investigate a variety of science concepts.
In this lesson, we are going to transfer data from the Micro:bit temperature sensor directly to our computer. This is a good introduction for the collection of data from Micro:bit sensors. The Micro:bit will collect sensor data. The data will be saved to a CSV, Comma Separated Value, file. The CSV file can be imported into any spreadsheet program. We will import the file into a Google Sheet and create a line chart.
Use the links below to get a copy of the project.
Make Code: https://makecode.microbit.org/_fkxHWh6LWbYg
Github: https://github.com/digitalmaestro/temperature-sensor-data
Micro:bit simulator and Make Code
Make Code offers an Integrated Development Environment, IDE, for the Micro:bit. The IDE includes a Micro:bit simulator. Use the link below to access the Make Code website. You don’t need a login account.
https://makdecode.microbit.org
Click the New Project button.

Use “temperature sensor data” for the project name; click the Create button.

Go to the Input code section; get the [on button A pressed] code and place it on the coding canvas.
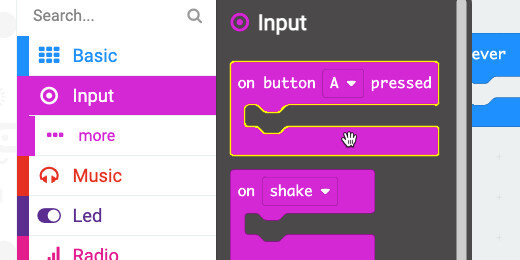
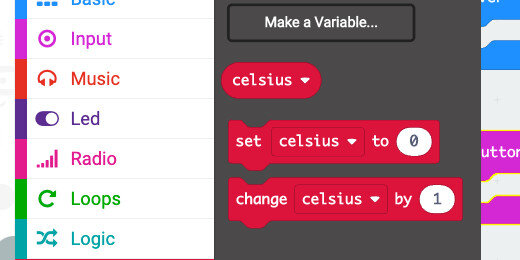
Go to the Variables section; click the "Make a variable" button.

Use “celsius” for the variable name; click the OK button.

Three code blocks are available for every variable. The first is the variable itself. The others include the set variable code block. This assigns a value to the variable. The other is the change variable code block. This code increments the value of a variable by a value of our choosing. This block is often used in counting and loops.
Get the [set celsius to] code block; place it in the [on button A pressed] function.

Go to the Input code section; find the [temperature] code block.

Place the code block into the [celsius] assignment parameter.

Go to the Basic code section; find the [pause] code block.

Place the [pause] code block below the [set celsius to] code.

Use the time selector; select 1-second.

Click the Advanced menu to display the advanced code blocks.

Select the Serial code section.

Find the [serial write value] code block.

Place the code block before the [pause] code.
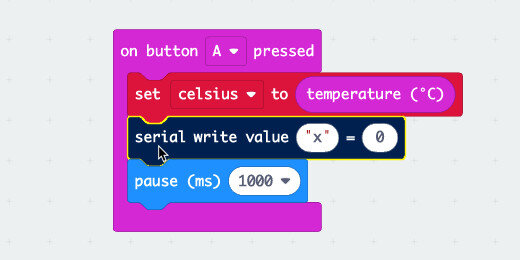
Type "celsius" in the value description field.

Go to the Variables section. Get the [celsius] variable; place it into the [serial write value] field.

This code will set the temperature sensor information and save it to the [celsius] variable. The value in the variable will be passed into the [serial write value] code. The serial write value code writes the values into a CSV file, which we will save later.
The code includes a one-second delay. We will use this delay later to collect sensor readings.
Go to the simulator area; press the A-button.

A simulated temperature meter appears on the Micro:bit. This represents fake temperature data.

A “Show console Simulator” button appears below the Micro:bit simulator; click the button.

The simulator includes a scrolling graph of the data collected by the sensor. The simulated sensor has collected one reading so there is no chart to create.

The values recorded by the program are shown in the section below.

Click the “Go back” button to return to the coding environment.

Device sensor information
We want to collect information from the real Micro:bit sensor. Connect your Micro:bit to the computer.
For the next step, I'm going to assume you have not paired your Micro:bit to the computer.
Click the more menu option; the three dots. Select the Pair device option.

Click “Pair device” when the instruction box opens.

Your browser might ask you to select the device to pair. Select the Micro:bit device and click the Connect button.

Click the More Actions button; select “Download to micro:bit”.

Don’t disconnect your Micro:bit from the computer. Click the A-button on the real Micro:bit.
A “Show console Device” button appears below the Micro:bit simulator; Click the button.

We have collected only one value, so the graph doesn’t show anything of interest.

The data area shows the first value collected by the Micro:bit. The temperature collected by my Micro:bit sensor is 27-degrees celsius.

Press the button on the Micro:bit a few times. Place the Micro:bit in your hand or on objects with different temperatures. Press the button each time to get a new temperature reading.
My Micro:bit recorded eight sensor readings. Five readings measured 27-degrees, two readings measured 28-degrees, and one measured 29.

The scrolling graph displays the changes in sensor readings over time.

Click the “Go back” button.
Collect multiple readings
Pressing the button to get a temperature reading is fine, but it is not the best way to get continuous readings from a single source. We are going to add some code so the sensor will get temperature readings at regular intervals.
Get the [repeat times] loop from the Loops section.

Move the loop into the [on button A pressed] function. Make sure the loop surrounds and incloses the existing code.

Change the repeat parameter from 4 to 60.

The [pause] code we added earlier is set to one second. Readings will be taken from the temperature every second. The program will do this 60 times. That gives us one minute's worth of temperature data.
Click the actions menu and download the program to the Micro:bit.

Press the A-button on the Micro:bit. Click the Show console Device button.

Temperature readings from the sensor will begin to be recorded. My Micro:bit is on my desk and reading the same temperature for every reading. It will stop taking readings when the number in the loop parameter is reached.

Ice water temperature
This is a simple way to test the program and collect data.
CAUTION!
PERFORM THIS PART OF THE LESSON ONLY IF YOU HAVE A WATER-TIGHT BAG FOR THE Micro:bit.
Get a bowl of water and add ice. Place the Micro:bit into a water-tight bag. I use a water-tight bag for cell phones. The bag is rated IPX8. This means the bag can be dropped into the water and the bag will not let water in for some time.

Press the A-button on the Micro:bit and submerge it into the ice water. I could not close the bag because of the cable so I held the top of the bag while the Micro:bit was in the ice water.

Click the Show console Device button. Watch as the sensor data is collected and displayed. The numbers in the grey represent the number of readings at that temperature. Each temperature has several identical readings. This is because we are taking one reading every second.

Watch the scrolling graph. The data collection is complete when the graph stops displaying the collection of data.

The data has been collected and temporarily stored in a text file. We need to download this file before anything else. Click the blue arrow to download the CSV file.

More temperature data
Taking a temperature reading every one-second might have been too much. Return to the code; change the pause duration from one to two seconds.

Click the actions menu and download the updated code to the Micro:bit. We always need to download any changes to the Micro:bit.

Repeating the experiment
Take the Micro:bit out of the ice water and pouch between measurements. Leave the Micro:bit out for about 5 minutes. This will give the Micro:bit some time to warm up to room temperature. Place the Micro:bit into the pouch after five minutes, press the button, and insert the Micro:bit into the ice water.
The process will take about two-minutes this time. Watch the graph being plotted and the data being collected. Download the CSV file when the process is complete.
Repeat the process one more time. Return to the code and change the pause duration to five-seconds. Download the updated code to the Micro:bit. Insert the Micro:bit into the ice water and collect the data. The process takes five minutes this time.
Note that we are taking the same number of readings. The only thing that is changing is the duration between readings. How does the duration relate to the data retrieved from the Micro:bit?
Importing data to Google Sheets
By now you should have at least two CSV files with temperature data. Open a new tab in your browser and create a new Google Sheet. The link below will take you to Google Sheets and create a new sheet. You will still need to log in with your account.
https://sheets.google.com/create
Click the sheet name; rename it to Micro:bit temperature data.

Click File and select Import.

Select the Upload option.

Click the “Select a file from your device” button.

Select the first CSV file; click the Open button.

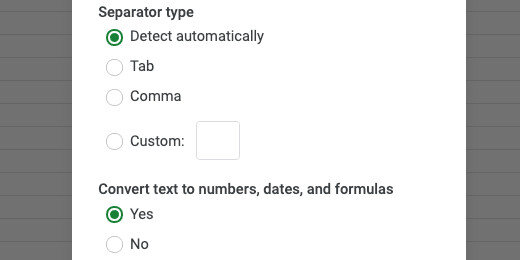
An import configuration box opens. Select the option to replace the Sheet.

Leave the other options set to detect the separator type automatically and convert the information automatically. Click the Import Data button.
The data includes some heading information. Erase the contents of the first cell, cell A1. Change the title for the time to "Time(seconds)". Update the title for celsius. Have it begin with a capital letter.
The first data value was taken at the moment we pressed the button. It was taken at zero seconds. We don’t need this data value. Select the cells and delete the information.

Select the cells with the data collected; include the headings.

Click the insert a chart button.

You should get a basic line chart.

Import more data
We will use the same sheet to import other data values.
Deselect the cells; click File and select Import.

Choose the Upload option and select the next CSV file. Choose the Insert new sheet(s) option from the import file configuration box. Click the Import data button.

Double click the sheet name; use “2 seconds” for the sheet name.

Cleanup the heading information like we did with the other import. Create a chart with the new data.
Repeat the process if you collected data from the sensor using five-seconds for the pause duration.
Use the link below to get a copy of the data I collected and uploaded to Google sheets. The first link gives you a preview. The second link will allow you to save a copy of the sheet to your Google Drive.